利用航拍图像量化曼哈顿的降温需求
IF 7.1
2区 工程技术
Q1 CONSTRUCTION & BUILDING TECHNOLOGY
引用次数: 0
摘要
冷却需求占全球电力消耗的很大一部分,其中空间冷却约占全球电力消耗的10%,而在欧盟,过程冷却占电力消耗的4%。为了实施更有效的供热、制冷和蓄热耦合的区域解决方案,制冷需求的空间信息是必不可少的。在本研究中,提出了一种量化建筑、区域和城市规模的制冷装机容量和制冷需求的方法,并将其应用于纽约市曼哈顿。因此,利用深度学习技术在航拍图像中检测冷却系统的散热单元。系统的制冷量是量化使用回归模型基于视觉特征的散热装置。根据建筑类型估算年运行时间,计算制冷需求。此外,利用能效比和蒙特卡罗模拟来量化与冷却相关的电力消耗,以评估不同尺度上所有参数的不确定性。曼哈顿地区制冷量总装机容量为10.6±0.2 GW,制冷需求为10.0±0.2 TWh/a,制冷用电量为2.82±0.05 TWh/a。大部分制冷需求集中在中城和金融区,最大的制冷消费者是大学和医院等公共建筑。中城和金融区的制冷需求分别占预计供暖需求的171%和175%。这表明耦合加热和冷却的潜力很大,例如,以季节性热能储存的形式,特别是在曼哈顿的命名区域及其周围。本文章由计算机程序翻译,如有差异,请以英文原文为准。
Quantifying the cooling demand of Manhattan using aerial images
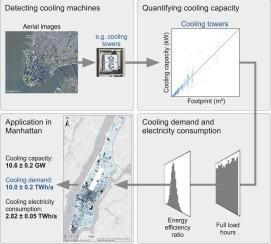
Cooling demand accounts for a significant share of worldwide electricity consumption, with space cooling being responsible for about 10 % of global electricity consumption, and process cooling making up for 4 % of electricity consumption in the European Union. To implement more efficient district-scale solutions for coupled heating, cooling and thermal storage, spatial information on cooling demand is essential. In this study, a method to quantify installed cooling capacities and cooling demands on building, district and city scale is presented and applied to Manhattan, New York City (NYC). Therefore, heat rejection units of cooling systems are detected in aerial images using deep learning. The cooling capacity of the systems is quantified using a regression model based on visual characteristics of the heat rejection units. The annual operating time is estimated based on building type to calculate the cooling demand. Furthermore, the cooling-related electricity consumption is quantified using energy efficiency ratios and through Monte Carlo simulation to assess the uncertainties of all parameters on different scales. In Manhattan, a total installed cooling capacity of 10.6 ± 0.2 GW, a cooling demand of 10.0 ± 0.2 TWh/a and a cooling-related electricity consumption of 2.82 ± 0.05 TWh/a is quantified. Most of the cooling demand is concentrated in Midtown and the Financial District, with the largest cold consumers being public buildings such as universities and hospitals. Midtown and the Financial District’s cooling demands are 171 % and 175 % of the estimated heating demands, respectively. This indicates a high potential for coupled heating and cooling, for example, in the form of seasonal thermal energy storage, especially in and around the named areas in Manhattan.
求助全文
通过发布文献求助,成功后即可免费获取论文全文。
去求助
来源期刊
Energy and Buildings
工程技术-工程:土木
CiteScore
12.70
自引率
11.90%
发文量
863
审稿时长
38 days
期刊介绍:
An international journal devoted to investigations of energy use and efficiency in buildings
Energy and Buildings is an international journal publishing articles with explicit links to energy use in buildings. The aim is to present new research results, and new proven practice aimed at reducing the energy needs of a building and improving indoor environment quality.
 求助内容:
求助内容: 应助结果提醒方式:


