Clancy Cerejo, Elias Mandler, Federico Carbone, Gabriel Bsteh, Barbara Teuchner, Katarína Schwarzová, Marina Peball, Atbin Djamshidian, Klaus Seppi, Beatrice Heim
{"title":"Optical coherence tomography - A possible biomarker in early huntington's disease.","authors":"Clancy Cerejo, Elias Mandler, Federico Carbone, Gabriel Bsteh, Barbara Teuchner, Katarína Schwarzová, Marina Peball, Atbin Djamshidian, Klaus Seppi, Beatrice Heim","doi":"10.1186/s42466-025-00421-z","DOIUrl":null,"url":null,"abstract":"<p><strong>Objective: </strong>To assess the role of spectral domain Optical Coherence Tomography (OCT) as a biomarker in Huntington's disease (HD).</p><p><strong>Methods: </strong>This cross-sectional study compared spectral domain OCT data, cognitive function, and olfactory function in HD patients and healthy controls (HC). HD patients were classified into Stage1 and Stage2 based on motor symptoms and functional capacity.</p><p><strong>Results: </strong>We recruited a total of 68 participants including 39HD patients (22 stage1, 17 stage2) and 29 age-matched HC. There were no significant differences in age and gender between the groups. Stage2 HD patients showed worse motor function (UHDRS-TMS 28.44 ± 18.13 vs. 13.74 ± 8.78, p = 0.002), functional capacity (UHDRS-TFC 8.13 ± 2.03 vs. 12.44 ± 0.99, p < 0.001), and lower scores on MMSE (27.36 ± 1.64 vs. 28.73 ± 1.74, p = 0.005 vs. 29.45 ± 0.91, p < 0.001) compared to stage1 HD patients and HC, respectively. Both stage1 and stage2 HD groups displayed significantly reduced macular retinal nerve fibre layer thickness (mRNFL) (33.45 ± 4.70, 31.90 ± 3.47 vs. 38.45 ± 5.00; p < 0.001) and ganglion cell-inner plexiform layer thickness (GCIPL) (71.63 ± 6.38, p = 0.007; 60.42 ± 4.67, p < 0.001 vs. 77.03 ± 8.40) as compared to HC. The retinal OCT parameters mRNFL and GCIPL correlated moderately with PIN<sub>HD</sub> (r=-0.424, r=-0.513; p < 0.001), CAP (r=-0.425, r=-0.482; p < 0.001) and olfactory dysfunction for both smell identification (r = 0.446, r = 0.500; p < 0.001) and smell discrimination (r = 0.563, r = 0.467; p < 0.001).</p><p><strong>Conclusions: </strong>HD patients exhibit significantly thinner retinal ganglion cell inner plexiform layer and macular retinal nerve fibre layer compared to HC, even in the early phase of the disease. These findings suggest that OCT may serve as a valuable biomarker to monitor neurodegeneration at an early disease stage.</p>","PeriodicalId":94156,"journal":{"name":"Neurological research and practice","volume":"7 1","pages":"61"},"PeriodicalIF":3.2000,"publicationDate":"2025-08-28","publicationTypes":"Journal Article","fieldsOfStudy":null,"isOpenAccess":false,"openAccessPdf":"https://www.ncbi.nlm.nih.gov/pmc/articles/PMC12395900/pdf/","citationCount":"0","resultStr":null,"platform":"Semanticscholar","paperid":null,"PeriodicalName":"Neurological research and practice","FirstCategoryId":"1085","ListUrlMain":"https://doi.org/10.1186/s42466-025-00421-z","RegionNum":0,"RegionCategory":null,"ArticlePicture":[],"TitleCN":null,"AbstractTextCN":null,"PMCID":null,"EPubDate":"","PubModel":"","JCR":"Q2","JCRName":"Medicine","Score":null,"Total":0}
引用次数: 0
Abstract
Objective: To assess the role of spectral domain Optical Coherence Tomography (OCT) as a biomarker in Huntington's disease (HD).
Methods: This cross-sectional study compared spectral domain OCT data, cognitive function, and olfactory function in HD patients and healthy controls (HC). HD patients were classified into Stage1 and Stage2 based on motor symptoms and functional capacity.
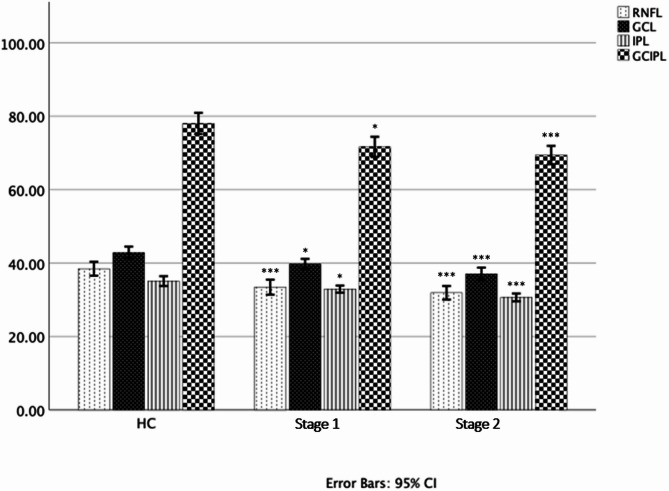
Results: We recruited a total of 68 participants including 39HD patients (22 stage1, 17 stage2) and 29 age-matched HC. There were no significant differences in age and gender between the groups. Stage2 HD patients showed worse motor function (UHDRS-TMS 28.44 ± 18.13 vs. 13.74 ± 8.78, p = 0.002), functional capacity (UHDRS-TFC 8.13 ± 2.03 vs. 12.44 ± 0.99, p < 0.001), and lower scores on MMSE (27.36 ± 1.64 vs. 28.73 ± 1.74, p = 0.005 vs. 29.45 ± 0.91, p < 0.001) compared to stage1 HD patients and HC, respectively. Both stage1 and stage2 HD groups displayed significantly reduced macular retinal nerve fibre layer thickness (mRNFL) (33.45 ± 4.70, 31.90 ± 3.47 vs. 38.45 ± 5.00; p < 0.001) and ganglion cell-inner plexiform layer thickness (GCIPL) (71.63 ± 6.38, p = 0.007; 60.42 ± 4.67, p < 0.001 vs. 77.03 ± 8.40) as compared to HC. The retinal OCT parameters mRNFL and GCIPL correlated moderately with PINHD (r=-0.424, r=-0.513; p < 0.001), CAP (r=-0.425, r=-0.482; p < 0.001) and olfactory dysfunction for both smell identification (r = 0.446, r = 0.500; p < 0.001) and smell discrimination (r = 0.563, r = 0.467; p < 0.001).
Conclusions: HD patients exhibit significantly thinner retinal ganglion cell inner plexiform layer and macular retinal nerve fibre layer compared to HC, even in the early phase of the disease. These findings suggest that OCT may serve as a valuable biomarker to monitor neurodegeneration at an early disease stage.

 求助内容:
求助内容: 应助结果提醒方式:


