Mathys J Labuschagne, Isabella du Preez, Helena Prior Filipe
{"title":"An Illustration is Worth Ten Thousand Words: An Extraordinary Approach to Presenting Information Through Infographics.","authors":"Mathys J Labuschagne, Isabella du Preez, Helena Prior Filipe","doi":"10.1007/s40670-025-02285-z","DOIUrl":null,"url":null,"abstract":"<p><strong>Introduction: </strong>Infographics summarise concepts visually for quick reference. Four infographics, inspired by articles on simulation-based education for ophthalmologists, were created to simplify complex ideas. The study evaluated the infographics' effectiveness aligning with published recommendations to make simulation education user-friendly and practical, supporting busy ophthalmologist educators in designing and facilitating simulation training sessions.</p><p><strong>Methods: </strong>This descriptive cross-sectional study evaluated the infographics created by the second author, focussing on their quality, visual appeal, and effectiveness in conveying the key messages to be used for microlearning and Just-in-Time Teaching (JiTT). An evidence-based electronic questionnaire was used to evaluate design principles of effective infographics. The same questions concerning each infographic were presented to ophthalmologist educators and graphic designers.</p><p><strong>Results: </strong>Feedback informed recommendations for infographics to define a target audience, highlight the heading, and ensure a clear narrative with an identifiable key message. Content should simplify complex concepts and be applicable to teaching. Include accessible references, limited colours and fonts, and logical alignment prioritising key elements. Use simple imagery and effective charts. Add a digital object identifier (DOI) for citation and discovery. Infographics can be shared via journals and social media, or used as Just-in-Time Teaching (JiTT) tools to support professional development and simulation teaching preparation.</p><p><strong>Conclusion: </strong>Effectively designed infographics as pragmatic focused graphic storytelling tools can support clinical educators in their daily simulation-based teaching activities and JiTT. This article provides tips on designing infographics for this purpose.</p>","PeriodicalId":37113,"journal":{"name":"Medical Science Educator","volume":"35 2","pages":"691-701"},"PeriodicalIF":1.8000,"publicationDate":"2025-01-28","publicationTypes":"Journal Article","fieldsOfStudy":null,"isOpenAccess":false,"openAccessPdf":"https://www.ncbi.nlm.nih.gov/pmc/articles/PMC12058597/pdf/","citationCount":"0","resultStr":null,"platform":"Semanticscholar","paperid":null,"PeriodicalName":"Medical Science Educator","FirstCategoryId":"1085","ListUrlMain":"https://doi.org/10.1007/s40670-025-02285-z","RegionNum":0,"RegionCategory":null,"ArticlePicture":[],"TitleCN":null,"AbstractTextCN":null,"PMCID":null,"EPubDate":"2025/4/1 0:00:00","PubModel":"eCollection","JCR":"Q2","JCRName":"EDUCATION, SCIENTIFIC DISCIPLINES","Score":null,"Total":0}
引用次数: 0
Abstract
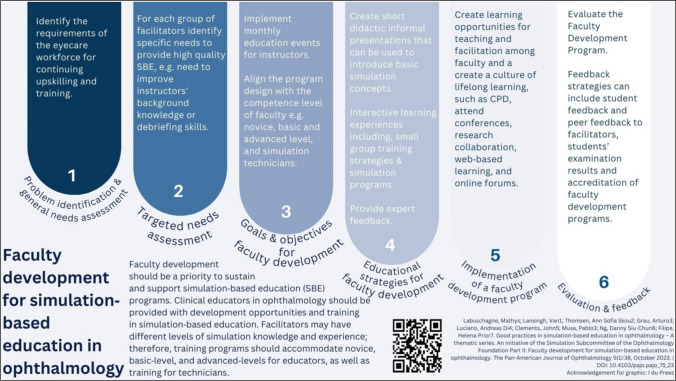
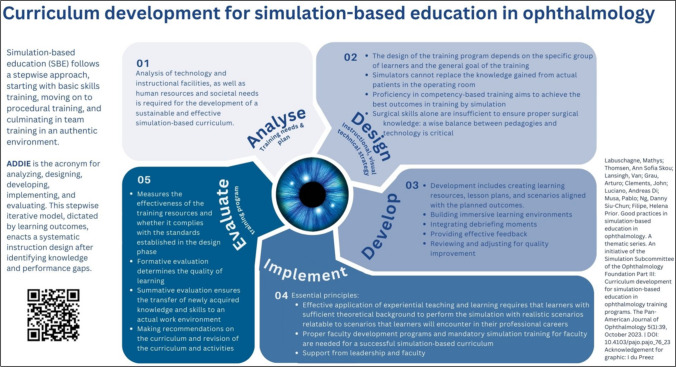
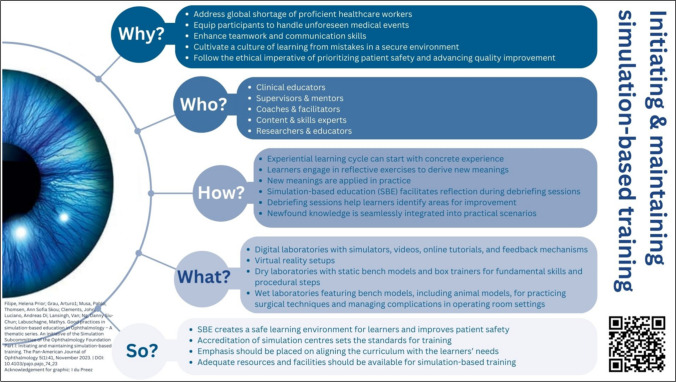
Introduction: Infographics summarise concepts visually for quick reference. Four infographics, inspired by articles on simulation-based education for ophthalmologists, were created to simplify complex ideas. The study evaluated the infographics' effectiveness aligning with published recommendations to make simulation education user-friendly and practical, supporting busy ophthalmologist educators in designing and facilitating simulation training sessions.
Methods: This descriptive cross-sectional study evaluated the infographics created by the second author, focussing on their quality, visual appeal, and effectiveness in conveying the key messages to be used for microlearning and Just-in-Time Teaching (JiTT). An evidence-based electronic questionnaire was used to evaluate design principles of effective infographics. The same questions concerning each infographic were presented to ophthalmologist educators and graphic designers.
Results: Feedback informed recommendations for infographics to define a target audience, highlight the heading, and ensure a clear narrative with an identifiable key message. Content should simplify complex concepts and be applicable to teaching. Include accessible references, limited colours and fonts, and logical alignment prioritising key elements. Use simple imagery and effective charts. Add a digital object identifier (DOI) for citation and discovery. Infographics can be shared via journals and social media, or used as Just-in-Time Teaching (JiTT) tools to support professional development and simulation teaching preparation.
Conclusion: Effectively designed infographics as pragmatic focused graphic storytelling tools can support clinical educators in their daily simulation-based teaching activities and JiTT. This article provides tips on designing infographics for this purpose.
期刊介绍:
Medical Science Educator is the successor of the journal JIAMSE. It is the peer-reviewed publication of the International Association of Medical Science Educators (IAMSE). The Journal offers all who teach in healthcare the most current information to succeed in their task by publishing scholarly activities, opinions, and resources in medical science education. Published articles focus on teaching the sciences fundamental to modern medicine and health, and include basic science education, clinical teaching, and the use of modern education technologies. The Journal provides the readership a better understanding of teaching and learning techniques in order to advance medical science education.
 求助内容:
求助内容: 应助结果提醒方式:


