Qiuping Wang, Yuan Su, Jing Niu, Yan Wang, Liping Liu, Yanhong Hao
{"title":"TyG-BMI与MAFLD之间的非线性关联:一项横断面研究。","authors":"Qiuping Wang, Yuan Su, Jing Niu, Yan Wang, Liping Liu, Yanhong Hao","doi":"10.1371/journal.pone.0331140","DOIUrl":null,"url":null,"abstract":"<p><strong>Background: </strong>The relationship between the triglyceride glucose-body mass index (TyG-BMI) and the incidence of metabolic associated fatty liver disease (MAFLD) is a trending research area. This association is highly important in the realms of healthcare and public health.</p><p><strong>Objective: </strong>To explore the impact of TyG-BMI on MAFLD and its contribution to the evolution of diverse phenotypes of fatty liver.</p><p><strong>Methods: </strong>In this cross-sectional study, curve fitting was used to assess the relationships between TyG-BMI and MAFLD as well as different MAFLD phenotypes, and multivariate ordinal logistic regression methods were employed to explore the stability of these relationships.</p><p><strong>Results: </strong>Curve fitting revealed a nonlinear relationship between TyG-BMI and MAFLD, with a critical threshold of approximately 176.78. Similar relationships were observed between TyG-BMI and different fatty liver phenotypes. Multivariate logistic regression revealed that the TyG-BMI was independently associated with different fatty liver phenotypes (nonfibrotic MAFLD odds ratio (OR) = 11.29; 95% confidence interval (CI) = 8.38-15.21, p < 0.001; fibrotic MAFLD OR = 37.24, 95% CI = 25.92-53.51, P < 0.001). Even after full variable adjustment, this relationship remained stable (nonfibrotic MAFLD OR = 5.99, 95% CI = 3.25--11.06, P < 0.001; fibrotic MAFLD OR = 5.24, 95% CI = 2.28--12.06, P < 0.001). Correlation analysis revealed a positive correlation between TyG-BMI and CAP (correlation coefficient, 0.60) and a weak positive correlation with SWE (correlation coefficient, 0.29).</p><p><strong>Conclusions: </strong>The TyG-BMI manifests a nonlinear relationship with the risk of developing distinct MAFLD phenotypes, suggesting its utility as a pivotal metric in the formulation of screening and preventive strategies for MAFLD.</p>","PeriodicalId":20189,"journal":{"name":"PLoS ONE","volume":"20 10","pages":"e0331140"},"PeriodicalIF":2.6000,"publicationDate":"2025-10-16","publicationTypes":"Journal Article","fieldsOfStudy":null,"isOpenAccess":false,"openAccessPdf":"https://www.ncbi.nlm.nih.gov/pmc/articles/PMC12530604/pdf/","citationCount":"0","resultStr":"{\"title\":\"Nonlinear association between TyG-BMI and MAFLD: A cross-sectional study.\",\"authors\":\"Qiuping Wang, Yuan Su, Jing Niu, Yan Wang, Liping Liu, Yanhong Hao\",\"doi\":\"10.1371/journal.pone.0331140\",\"DOIUrl\":null,\"url\":null,\"abstract\":\"<p><strong>Background: </strong>The relationship between the triglyceride glucose-body mass index (TyG-BMI) and the incidence of metabolic associated fatty liver disease (MAFLD) is a trending research area. This association is highly important in the realms of healthcare and public health.</p><p><strong>Objective: </strong>To explore the impact of TyG-BMI on MAFLD and its contribution to the evolution of diverse phenotypes of fatty liver.</p><p><strong>Methods: </strong>In this cross-sectional study, curve fitting was used to assess the relationships between TyG-BMI and MAFLD as well as different MAFLD phenotypes, and multivariate ordinal logistic regression methods were employed to explore the stability of these relationships.</p><p><strong>Results: </strong>Curve fitting revealed a nonlinear relationship between TyG-BMI and MAFLD, with a critical threshold of approximately 176.78. Similar relationships were observed between TyG-BMI and different fatty liver phenotypes. Multivariate logistic regression revealed that the TyG-BMI was independently associated with different fatty liver phenotypes (nonfibrotic MAFLD odds ratio (OR) = 11.29; 95% confidence interval (CI) = 8.38-15.21, p < 0.001; fibrotic MAFLD OR = 37.24, 95% CI = 25.92-53.51, P < 0.001). Even after full variable adjustment, this relationship remained stable (nonfibrotic MAFLD OR = 5.99, 95% CI = 3.25--11.06, P < 0.001; fibrotic MAFLD OR = 5.24, 95% CI = 2.28--12.06, P < 0.001). Correlation analysis revealed a positive correlation between TyG-BMI and CAP (correlation coefficient, 0.60) and a weak positive correlation with SWE (correlation coefficient, 0.29).</p><p><strong>Conclusions: </strong>The TyG-BMI manifests a nonlinear relationship with the risk of developing distinct MAFLD phenotypes, suggesting its utility as a pivotal metric in the formulation of screening and preventive strategies for MAFLD.</p>\",\"PeriodicalId\":20189,\"journal\":{\"name\":\"PLoS ONE\",\"volume\":\"20 10\",\"pages\":\"e0331140\"},\"PeriodicalIF\":2.6000,\"publicationDate\":\"2025-10-16\",\"publicationTypes\":\"Journal Article\",\"fieldsOfStudy\":null,\"isOpenAccess\":false,\"openAccessPdf\":\"https://www.ncbi.nlm.nih.gov/pmc/articles/PMC12530604/pdf/\",\"citationCount\":\"0\",\"resultStr\":null,\"platform\":\"Semanticscholar\",\"paperid\":null,\"PeriodicalName\":\"PLoS ONE\",\"FirstCategoryId\":\"103\",\"ListUrlMain\":\"https://doi.org/10.1371/journal.pone.0331140\",\"RegionNum\":3,\"RegionCategory\":\"综合性期刊\",\"ArticlePicture\":[],\"TitleCN\":null,\"AbstractTextCN\":null,\"PMCID\":null,\"EPubDate\":\"2025/1/1 0:00:00\",\"PubModel\":\"eCollection\",\"JCR\":\"Q1\",\"JCRName\":\"MULTIDISCIPLINARY SCIENCES\",\"Score\":null,\"Total\":0}","platform":"Semanticscholar","paperid":null,"PeriodicalName":"PLoS ONE","FirstCategoryId":"103","ListUrlMain":"https://doi.org/10.1371/journal.pone.0331140","RegionNum":3,"RegionCategory":"综合性期刊","ArticlePicture":[],"TitleCN":null,"AbstractTextCN":null,"PMCID":null,"EPubDate":"2025/1/1 0:00:00","PubModel":"eCollection","JCR":"Q1","JCRName":"MULTIDISCIPLINARY SCIENCES","Score":null,"Total":0}
Nonlinear association between TyG-BMI and MAFLD: A cross-sectional study.
Background: The relationship between the triglyceride glucose-body mass index (TyG-BMI) and the incidence of metabolic associated fatty liver disease (MAFLD) is a trending research area. This association is highly important in the realms of healthcare and public health.
Objective: To explore the impact of TyG-BMI on MAFLD and its contribution to the evolution of diverse phenotypes of fatty liver.
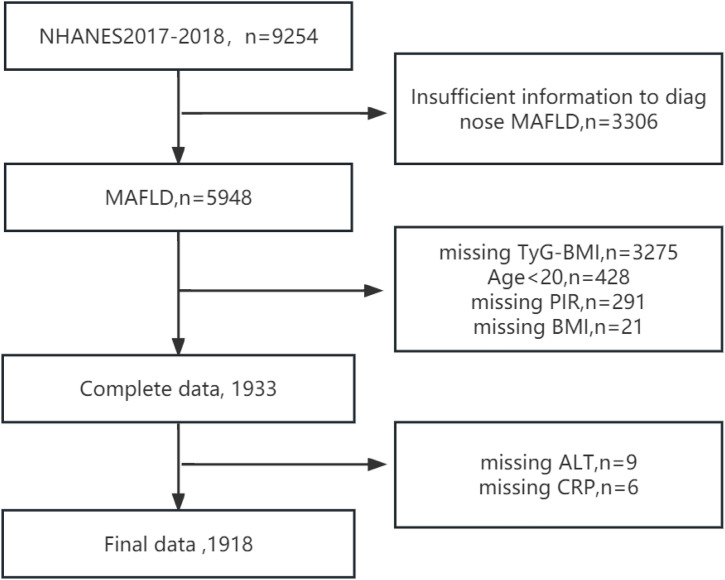
Methods: In this cross-sectional study, curve fitting was used to assess the relationships between TyG-BMI and MAFLD as well as different MAFLD phenotypes, and multivariate ordinal logistic regression methods were employed to explore the stability of these relationships.
Results: Curve fitting revealed a nonlinear relationship between TyG-BMI and MAFLD, with a critical threshold of approximately 176.78. Similar relationships were observed between TyG-BMI and different fatty liver phenotypes. Multivariate logistic regression revealed that the TyG-BMI was independently associated with different fatty liver phenotypes (nonfibrotic MAFLD odds ratio (OR) = 11.29; 95% confidence interval (CI) = 8.38-15.21, p < 0.001; fibrotic MAFLD OR = 37.24, 95% CI = 25.92-53.51, P < 0.001). Even after full variable adjustment, this relationship remained stable (nonfibrotic MAFLD OR = 5.99, 95% CI = 3.25--11.06, P < 0.001; fibrotic MAFLD OR = 5.24, 95% CI = 2.28--12.06, P < 0.001). Correlation analysis revealed a positive correlation between TyG-BMI and CAP (correlation coefficient, 0.60) and a weak positive correlation with SWE (correlation coefficient, 0.29).
Conclusions: The TyG-BMI manifests a nonlinear relationship with the risk of developing distinct MAFLD phenotypes, suggesting its utility as a pivotal metric in the formulation of screening and preventive strategies for MAFLD.
期刊介绍:
PLOS ONE is an international, peer-reviewed, open-access, online publication. PLOS ONE welcomes reports on primary research from any scientific discipline. It provides:
* Open-access—freely accessible online, authors retain copyright
* Fast publication times
* Peer review by expert, practicing researchers
* Post-publication tools to indicate quality and impact
* Community-based dialogue on articles
* Worldwide media coverage


 求助内容:
求助内容: 应助结果提醒方式:


