Chunbo Wang, Wenji Yu, Xiaoyu Yang, Fan Sun, Yu Tian, Yue Yue, Feifei Zhang, Xiaoliang Shao, Yunmei Shi, Bao Liu, Jianfeng Wang, Sijin Li, Yuetao Wang
{"title":"基于解剖和功能成像的心外膜脂肪体积指数与冠状动脉疾病表型的关联:与冠状动脉疾病严重程度的关联","authors":"Chunbo Wang, Wenji Yu, Xiaoyu Yang, Fan Sun, Yu Tian, Yue Yue, Feifei Zhang, Xiaoliang Shao, Yunmei Shi, Bao Liu, Jianfeng Wang, Sijin Li, Yuetao Wang","doi":"10.1186/s12933-025-02897-0","DOIUrl":null,"url":null,"abstract":"<p><strong>Background: </strong>Epicardial adipose tissue (EAT) plays an important role in the pathogenesis of coronary artery disease (CAD). The association between EAT and obstructive CAD or myocardial ischemia has been established, but its relationship with CAD phenotypes based on anatomical and functional imaging remains unclear.</p><p><strong>Methods: </strong>A total of 495 suspected CAD patients who underwent both single-photon emission computed tomography/computed tomography myocardial perfusion imaging (SPECT/CT MPI) and coronary angiography (CAG/CTA) were enrolled in this retrospective study. Epicardial fat volume (EFV) and epicardial fat volume indexed to body surface (EFVi) were measured on non-contrast CT. CAD phenotypes were categorized into 4 groups based on the presence or absence of obstructive CAD (any epicardial coronary diameter stenosis ≥ 50% by CAG/CTA) and myocardial ischemia (diagnosed by MPI): Group1 (non-obstructive CAD without ischemia, n = 165), Group2 (ischemia with non-obstructive CAD, INOCA, n = 69), Group3 (obstructive CAD without ischemia, n = 149), Group4 (obstructive CAD with ischemia, n = 112).</p><p><strong>Results: </strong>Both EFV and EFVi had an increasing trend across 4 groups [EFVi: median (interquartile range), cm<sup>3</sup>/m<sup>2</sup>: 80.54 (68.10-102.37) vs. 84.44 (73.57-100.93) vs. 89.63 (75.39-103.15) vs. 91.67 (76.48-111.66), p = 0.007, p for trend < 0.001]. In adjusted ordered logistic regression model, EFVi was independently associated with more advanced CAD phenotype levels (per SD unit change: OR = 1.26, 95% CI:1.03-1.55, p = 0.024). Subgroup analysis showed diabetes subgroup had the strongest correlation between EFVi and CAD phenotype levels in ordered logistic regression model (OR = 3.45, 95%CI:1.52-7.82, p = 0.003). In adjusted unordered multinomial logistic regression model, with Group1 as reference group, maximizing Youden index method was used to find the optimal cutoff values for EFV/EFVi on Group2 to Group4. Both EFV and EFVi were independently associated with Group3 and Group4 but only EFVi was independently associated with INOCA (EFV: EFV >134.47cm<sup>3</sup> for INOCA, OR = 1.94, 95%CI:0.97-3.88, p = 0.058, EFVi: EFVi >80.67cm<sup>3</sup>/m<sup>2</sup> for INOCA, OR = 2.53, 95%CI:1.25-5.12, p = 0.010). Net reclassification improvement (NRI) showed that EFVi was more effective than EFV in diabetes subgroup to differentiate CAD phenotypes over traditional cardiovascular risk factors.</p><p><strong>Conclusion: </strong>EFVi was correlated with the severity of CAD phenotype levels based on anatomical and functional imaging. EFVi had the strongest correlation with CAD phenotypes levels in diabetes subgroup. Notably, EFVi rather than EFV exhibits a distinct linkage with INOCA. EFVi was more effective to provide incremental value of differentiating CAD phenotypes over traditional cardiovascular risk factors than EFV in diabetes subgroup.</p>","PeriodicalId":9374,"journal":{"name":"Cardiovascular Diabetology","volume":"24 1","pages":"387"},"PeriodicalIF":10.6000,"publicationDate":"2025-10-08","publicationTypes":"Journal Article","fieldsOfStudy":null,"isOpenAccess":false,"openAccessPdf":"https://www.ncbi.nlm.nih.gov/pmc/articles/PMC12505754/pdf/","citationCount":"0","resultStr":"{\"title\":\"Association of epicardial fat volume index with coronary artery disease phenotypes based on anatomical and functional imaging: a linkage with the severity of coronary artery disease.\",\"authors\":\"Chunbo Wang, Wenji Yu, Xiaoyu Yang, Fan Sun, Yu Tian, Yue Yue, Feifei Zhang, Xiaoliang Shao, Yunmei Shi, Bao Liu, Jianfeng Wang, Sijin Li, Yuetao Wang\",\"doi\":\"10.1186/s12933-025-02897-0\",\"DOIUrl\":null,\"url\":null,\"abstract\":\"<p><strong>Background: </strong>Epicardial adipose tissue (EAT) plays an important role in the pathogenesis of coronary artery disease (CAD). The association between EAT and obstructive CAD or myocardial ischemia has been established, but its relationship with CAD phenotypes based on anatomical and functional imaging remains unclear.</p><p><strong>Methods: </strong>A total of 495 suspected CAD patients who underwent both single-photon emission computed tomography/computed tomography myocardial perfusion imaging (SPECT/CT MPI) and coronary angiography (CAG/CTA) were enrolled in this retrospective study. Epicardial fat volume (EFV) and epicardial fat volume indexed to body surface (EFVi) were measured on non-contrast CT. CAD phenotypes were categorized into 4 groups based on the presence or absence of obstructive CAD (any epicardial coronary diameter stenosis ≥ 50% by CAG/CTA) and myocardial ischemia (diagnosed by MPI): Group1 (non-obstructive CAD without ischemia, n = 165), Group2 (ischemia with non-obstructive CAD, INOCA, n = 69), Group3 (obstructive CAD without ischemia, n = 149), Group4 (obstructive CAD with ischemia, n = 112).</p><p><strong>Results: </strong>Both EFV and EFVi had an increasing trend across 4 groups [EFVi: median (interquartile range), cm<sup>3</sup>/m<sup>2</sup>: 80.54 (68.10-102.37) vs. 84.44 (73.57-100.93) vs. 89.63 (75.39-103.15) vs. 91.67 (76.48-111.66), p = 0.007, p for trend < 0.001]. In adjusted ordered logistic regression model, EFVi was independently associated with more advanced CAD phenotype levels (per SD unit change: OR = 1.26, 95% CI:1.03-1.55, p = 0.024). Subgroup analysis showed diabetes subgroup had the strongest correlation between EFVi and CAD phenotype levels in ordered logistic regression model (OR = 3.45, 95%CI:1.52-7.82, p = 0.003). In adjusted unordered multinomial logistic regression model, with Group1 as reference group, maximizing Youden index method was used to find the optimal cutoff values for EFV/EFVi on Group2 to Group4. Both EFV and EFVi were independently associated with Group3 and Group4 but only EFVi was independently associated with INOCA (EFV: EFV >134.47cm<sup>3</sup> for INOCA, OR = 1.94, 95%CI:0.97-3.88, p = 0.058, EFVi: EFVi >80.67cm<sup>3</sup>/m<sup>2</sup> for INOCA, OR = 2.53, 95%CI:1.25-5.12, p = 0.010). Net reclassification improvement (NRI) showed that EFVi was more effective than EFV in diabetes subgroup to differentiate CAD phenotypes over traditional cardiovascular risk factors.</p><p><strong>Conclusion: </strong>EFVi was correlated with the severity of CAD phenotype levels based on anatomical and functional imaging. EFVi had the strongest correlation with CAD phenotypes levels in diabetes subgroup. Notably, EFVi rather than EFV exhibits a distinct linkage with INOCA. EFVi was more effective to provide incremental value of differentiating CAD phenotypes over traditional cardiovascular risk factors than EFV in diabetes subgroup.</p>\",\"PeriodicalId\":9374,\"journal\":{\"name\":\"Cardiovascular Diabetology\",\"volume\":\"24 1\",\"pages\":\"387\"},\"PeriodicalIF\":10.6000,\"publicationDate\":\"2025-10-08\",\"publicationTypes\":\"Journal Article\",\"fieldsOfStudy\":null,\"isOpenAccess\":false,\"openAccessPdf\":\"https://www.ncbi.nlm.nih.gov/pmc/articles/PMC12505754/pdf/\",\"citationCount\":\"0\",\"resultStr\":null,\"platform\":\"Semanticscholar\",\"paperid\":null,\"PeriodicalName\":\"Cardiovascular Diabetology\",\"FirstCategoryId\":\"3\",\"ListUrlMain\":\"https://doi.org/10.1186/s12933-025-02897-0\",\"RegionNum\":1,\"RegionCategory\":\"医学\",\"ArticlePicture\":[],\"TitleCN\":null,\"AbstractTextCN\":null,\"PMCID\":null,\"EPubDate\":\"\",\"PubModel\":\"\",\"JCR\":\"Q1\",\"JCRName\":\"CARDIAC & CARDIOVASCULAR SYSTEMS\",\"Score\":null,\"Total\":0}","platform":"Semanticscholar","paperid":null,"PeriodicalName":"Cardiovascular Diabetology","FirstCategoryId":"3","ListUrlMain":"https://doi.org/10.1186/s12933-025-02897-0","RegionNum":1,"RegionCategory":"医学","ArticlePicture":[],"TitleCN":null,"AbstractTextCN":null,"PMCID":null,"EPubDate":"","PubModel":"","JCR":"Q1","JCRName":"CARDIAC & CARDIOVASCULAR SYSTEMS","Score":null,"Total":0}
引用次数: 0
摘要
背景:心外膜脂肪组织(EAT)在冠状动脉疾病(CAD)的发病机制中起重要作用。EAT与阻塞性CAD或心肌缺血之间的关联已经确立,但其与基于解剖和功能成像的CAD表型的关系尚不清楚。方法:采用单光子发射计算机断层扫描/计算机断层扫描心肌灌注显像(SPECT/CT MPI)和冠状动脉造影(CAG/CTA)对495例疑似CAD患者进行回顾性研究。在非对比CT上测量心外膜脂肪体积(EFV)和体表指标心外膜脂肪体积(EFVi)。根据是否存在梗阻性CAD (CAG/CTA检测心外膜冠状动脉直径狭窄≥50%)和心肌缺血(MPI诊断)将CAD表型分为4组:Group1(无缺血非梗阻性CAD, n = 165)、Group2(缺血合并非梗阻性CAD, INOCA, n = 69)、Group3(无缺血梗阻性CAD, n = 149)、Group4(有缺血梗阻性CAD, n = 112)。结果:EFV和EFVi在4组间均呈上升趋势[EFVi:中位数(四分位间距),cm3/m2: 80.54 (68.10-102.37) vs. 84.44 (73.57-100.93) vs. 89.63 (75.39-103.15) vs. 91.67 (76.48-111.66), p = 0.007, p < 0.001]。在调整有序逻辑回归模型中,EFVi与更高级的CAD表型水平独立相关(每SD单位变化:OR = 1.26, 95% CI:1.03-1.55, p = 0.024)。亚组分析显示,在有序logistic回归模型中,糖尿病亚组EFVi与CAD表型水平相关性最强(OR = 3.45, 95%CI:1.52 ~ 7.82, p = 0.003)。在调整后的无序多项logistic回归模型中,以Group1为参照组,采用最大化约登指数法寻找Group2 ~ Group4 EFV/EFVi的最优截断值。EFV和EFVi均与Group3和Group4独立相关,但只有EFVi与INOCA独立相关(INOCA EFV: EFV >134.47cm3, OR = 1.94, 95%CI:0.97-3.88, p = 0.058; INOCA EFVi: EFVi >80.67cm3/m2, OR = 2.53, 95%CI:1.25-5.12, p = 0.010)。净重分类改善(NRI)显示,在糖尿病亚组中,EFVi比EFV更有效地区分CAD表型与传统心血管危险因素。结论:基于解剖和功能成像,EFVi与CAD表型水平的严重程度相关。糖尿病亚组EFVi与CAD表型水平相关性最强。值得注意的是,EFVi而不是EFV与INOCA有明显的联系。在糖尿病亚组中,EFVi比EFV更有效地提供了区分CAD表型与传统心血管危险因素的增量价值。
Association of epicardial fat volume index with coronary artery disease phenotypes based on anatomical and functional imaging: a linkage with the severity of coronary artery disease.
Background: Epicardial adipose tissue (EAT) plays an important role in the pathogenesis of coronary artery disease (CAD). The association between EAT and obstructive CAD or myocardial ischemia has been established, but its relationship with CAD phenotypes based on anatomical and functional imaging remains unclear.
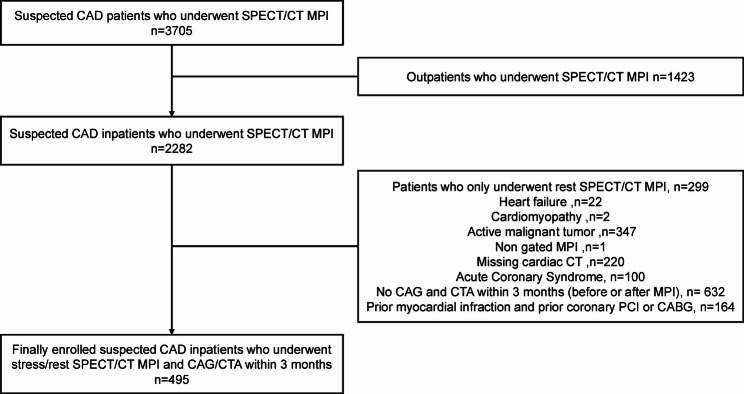
Methods: A total of 495 suspected CAD patients who underwent both single-photon emission computed tomography/computed tomography myocardial perfusion imaging (SPECT/CT MPI) and coronary angiography (CAG/CTA) were enrolled in this retrospective study. Epicardial fat volume (EFV) and epicardial fat volume indexed to body surface (EFVi) were measured on non-contrast CT. CAD phenotypes were categorized into 4 groups based on the presence or absence of obstructive CAD (any epicardial coronary diameter stenosis ≥ 50% by CAG/CTA) and myocardial ischemia (diagnosed by MPI): Group1 (non-obstructive CAD without ischemia, n = 165), Group2 (ischemia with non-obstructive CAD, INOCA, n = 69), Group3 (obstructive CAD without ischemia, n = 149), Group4 (obstructive CAD with ischemia, n = 112).
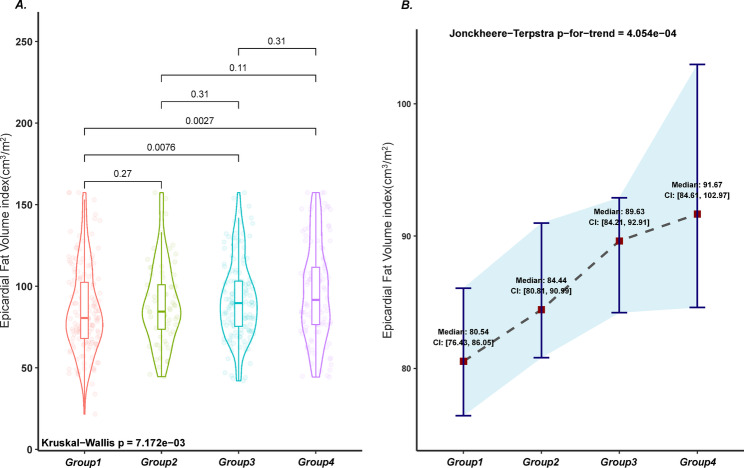
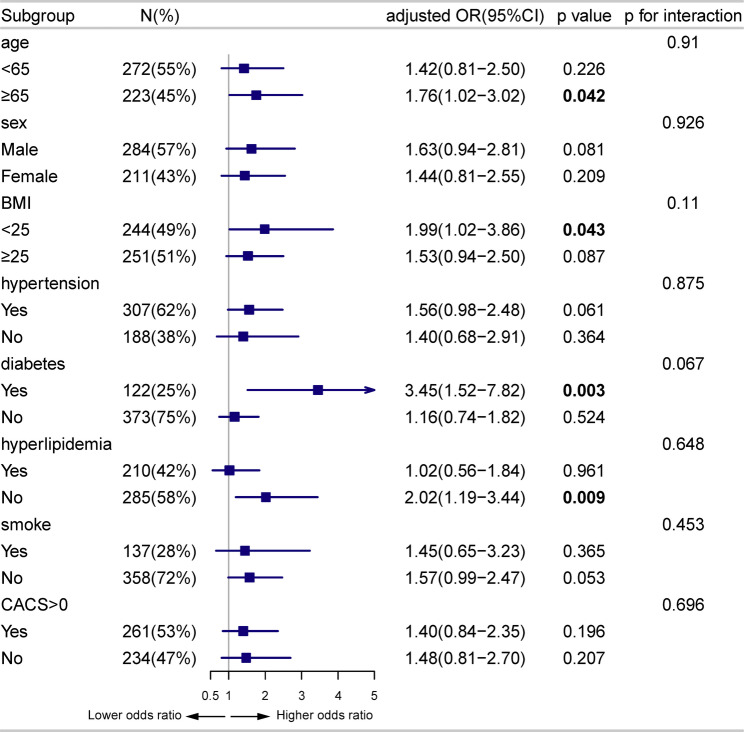
Results: Both EFV and EFVi had an increasing trend across 4 groups [EFVi: median (interquartile range), cm3/m2: 80.54 (68.10-102.37) vs. 84.44 (73.57-100.93) vs. 89.63 (75.39-103.15) vs. 91.67 (76.48-111.66), p = 0.007, p for trend < 0.001]. In adjusted ordered logistic regression model, EFVi was independently associated with more advanced CAD phenotype levels (per SD unit change: OR = 1.26, 95% CI:1.03-1.55, p = 0.024). Subgroup analysis showed diabetes subgroup had the strongest correlation between EFVi and CAD phenotype levels in ordered logistic regression model (OR = 3.45, 95%CI:1.52-7.82, p = 0.003). In adjusted unordered multinomial logistic regression model, with Group1 as reference group, maximizing Youden index method was used to find the optimal cutoff values for EFV/EFVi on Group2 to Group4. Both EFV and EFVi were independently associated with Group3 and Group4 but only EFVi was independently associated with INOCA (EFV: EFV >134.47cm3 for INOCA, OR = 1.94, 95%CI:0.97-3.88, p = 0.058, EFVi: EFVi >80.67cm3/m2 for INOCA, OR = 2.53, 95%CI:1.25-5.12, p = 0.010). Net reclassification improvement (NRI) showed that EFVi was more effective than EFV in diabetes subgroup to differentiate CAD phenotypes over traditional cardiovascular risk factors.
Conclusion: EFVi was correlated with the severity of CAD phenotype levels based on anatomical and functional imaging. EFVi had the strongest correlation with CAD phenotypes levels in diabetes subgroup. Notably, EFVi rather than EFV exhibits a distinct linkage with INOCA. EFVi was more effective to provide incremental value of differentiating CAD phenotypes over traditional cardiovascular risk factors than EFV in diabetes subgroup.
期刊介绍:
Cardiovascular Diabetology is a journal that welcomes manuscripts exploring various aspects of the relationship between diabetes, cardiovascular health, and the metabolic syndrome. We invite submissions related to clinical studies, genetic investigations, experimental research, pharmacological studies, epidemiological analyses, and molecular biology research in this field.
 求助内容:
求助内容: 应助结果提醒方式:


