Stephen P Colegate, Michael Seid, David Hartley, Aaron Flicker, Joseph Bruce, Joseph Michael, Mfonobong Udoko, Andrew F Beck, Cole Brokamp
{"title":"制定和评估时间序列算法预测每日哮喘住院人数。","authors":"Stephen P Colegate, Michael Seid, David Hartley, Aaron Flicker, Joseph Bruce, Joseph Michael, Mfonobong Udoko, Andrew F Beck, Cole Brokamp","doi":"10.1017/cts.2025.10111","DOIUrl":null,"url":null,"abstract":"<p><strong>Introduction: </strong>Asthma exacerbations are frequent causes of pediatric hospital admissions. We sought to develop a time series algorithm to forecast next-day daily asthma hospitalizations.</p><p><strong>Methods: </strong>Daily hospitalizations for asthma were collected at Cincinnati Children's from January 1, 2016, to December 31, 2023. We evaluated Autoregressive Integrated Moving Average (ARIMA), Exponential Smoothing (ETS), Prophet, and Ensemble models to forecast next-day asthma hospitalizations validated on 2023 data, considering varying historical training data lengths. Forecasts were calibrated to identify days exceeding a 5% high-risk threshold of historical totals and considered multiple validation years and years before and during the COVID-19 pandemic.</p><p><strong>Results: </strong>A total of 5,593 hospital admissions were recorded for asthma. Over 2,922 days, 166 days met the 5% high-risk threshold equating to 6 or more admissions. The Ensemble (Median Absolute Percentage Error (MAPE): 46.7%; Positive Predictive Value (PPV): 0.278; Negative Predictive Value (NPV): 0.942; Area Under the ROC Curve (AUC): 0.740; Sensitivity: 0.800; Specificity: 0.656) model achieved higher accuracy of high-risk days than ARIMA (MAPE: 46.5%; PPV: 0.278; NPV: 0.942; AUC: 0.709; Sensitivity: 0.760; Specificity: 0.571), ETS (MAPE: 47.2%; PPV: 0.222; NPV: 0.939; AUC: 0.711; Sensitivity: 0.800; Specificity: 0.668), and Prophet (MAPE: 48.9%; PPV: 0.444; NPV: 0.951; AUC: 0.732; Sensitivity: 0.680; Specificity: 0.741) models.</p><p><strong>Conclusions: </strong>Our Ensemble model of mean predictions from ARIMA, ETS, and Prophet models was the most accurate in forecasting future asthma hospitalizations. Integrating forecasting techniques with clinical operations could enable proactive prevention through enhanced population care management.</p>","PeriodicalId":15529,"journal":{"name":"Journal of Clinical and Translational Science","volume":"9 1","pages":"e185"},"PeriodicalIF":2.0000,"publicationDate":"2025-07-30","publicationTypes":"Journal Article","fieldsOfStudy":null,"isOpenAccess":false,"openAccessPdf":"https://www.ncbi.nlm.nih.gov/pmc/articles/PMC12444699/pdf/","citationCount":"0","resultStr":"{\"title\":\"Formulating and evaluating time series algorithms to forecast daily asthma hospital admissions.\",\"authors\":\"Stephen P Colegate, Michael Seid, David Hartley, Aaron Flicker, Joseph Bruce, Joseph Michael, Mfonobong Udoko, Andrew F Beck, Cole Brokamp\",\"doi\":\"10.1017/cts.2025.10111\",\"DOIUrl\":null,\"url\":null,\"abstract\":\"<p><strong>Introduction: </strong>Asthma exacerbations are frequent causes of pediatric hospital admissions. We sought to develop a time series algorithm to forecast next-day daily asthma hospitalizations.</p><p><strong>Methods: </strong>Daily hospitalizations for asthma were collected at Cincinnati Children's from January 1, 2016, to December 31, 2023. We evaluated Autoregressive Integrated Moving Average (ARIMA), Exponential Smoothing (ETS), Prophet, and Ensemble models to forecast next-day asthma hospitalizations validated on 2023 data, considering varying historical training data lengths. Forecasts were calibrated to identify days exceeding a 5% high-risk threshold of historical totals and considered multiple validation years and years before and during the COVID-19 pandemic.</p><p><strong>Results: </strong>A total of 5,593 hospital admissions were recorded for asthma. Over 2,922 days, 166 days met the 5% high-risk threshold equating to 6 or more admissions. The Ensemble (Median Absolute Percentage Error (MAPE): 46.7%; Positive Predictive Value (PPV): 0.278; Negative Predictive Value (NPV): 0.942; Area Under the ROC Curve (AUC): 0.740; Sensitivity: 0.800; Specificity: 0.656) model achieved higher accuracy of high-risk days than ARIMA (MAPE: 46.5%; PPV: 0.278; NPV: 0.942; AUC: 0.709; Sensitivity: 0.760; Specificity: 0.571), ETS (MAPE: 47.2%; PPV: 0.222; NPV: 0.939; AUC: 0.711; Sensitivity: 0.800; Specificity: 0.668), and Prophet (MAPE: 48.9%; PPV: 0.444; NPV: 0.951; AUC: 0.732; Sensitivity: 0.680; Specificity: 0.741) models.</p><p><strong>Conclusions: </strong>Our Ensemble model of mean predictions from ARIMA, ETS, and Prophet models was the most accurate in forecasting future asthma hospitalizations. Integrating forecasting techniques with clinical operations could enable proactive prevention through enhanced population care management.</p>\",\"PeriodicalId\":15529,\"journal\":{\"name\":\"Journal of Clinical and Translational Science\",\"volume\":\"9 1\",\"pages\":\"e185\"},\"PeriodicalIF\":2.0000,\"publicationDate\":\"2025-07-30\",\"publicationTypes\":\"Journal Article\",\"fieldsOfStudy\":null,\"isOpenAccess\":false,\"openAccessPdf\":\"https://www.ncbi.nlm.nih.gov/pmc/articles/PMC12444699/pdf/\",\"citationCount\":\"0\",\"resultStr\":null,\"platform\":\"Semanticscholar\",\"paperid\":null,\"PeriodicalName\":\"Journal of Clinical and Translational Science\",\"FirstCategoryId\":\"1085\",\"ListUrlMain\":\"https://doi.org/10.1017/cts.2025.10111\",\"RegionNum\":0,\"RegionCategory\":null,\"ArticlePicture\":[],\"TitleCN\":null,\"AbstractTextCN\":null,\"PMCID\":null,\"EPubDate\":\"2025/1/1 0:00:00\",\"PubModel\":\"eCollection\",\"JCR\":\"Q3\",\"JCRName\":\"MEDICINE, RESEARCH & EXPERIMENTAL\",\"Score\":null,\"Total\":0}","platform":"Semanticscholar","paperid":null,"PeriodicalName":"Journal of Clinical and Translational Science","FirstCategoryId":"1085","ListUrlMain":"https://doi.org/10.1017/cts.2025.10111","RegionNum":0,"RegionCategory":null,"ArticlePicture":[],"TitleCN":null,"AbstractTextCN":null,"PMCID":null,"EPubDate":"2025/1/1 0:00:00","PubModel":"eCollection","JCR":"Q3","JCRName":"MEDICINE, RESEARCH & EXPERIMENTAL","Score":null,"Total":0}
Formulating and evaluating time series algorithms to forecast daily asthma hospital admissions.
Introduction: Asthma exacerbations are frequent causes of pediatric hospital admissions. We sought to develop a time series algorithm to forecast next-day daily asthma hospitalizations.
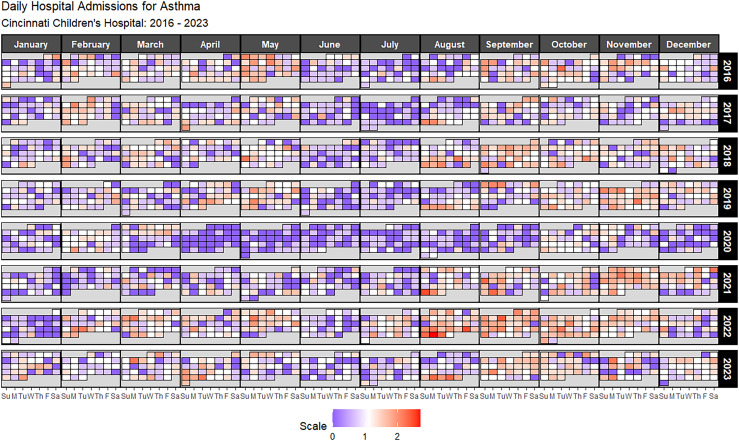
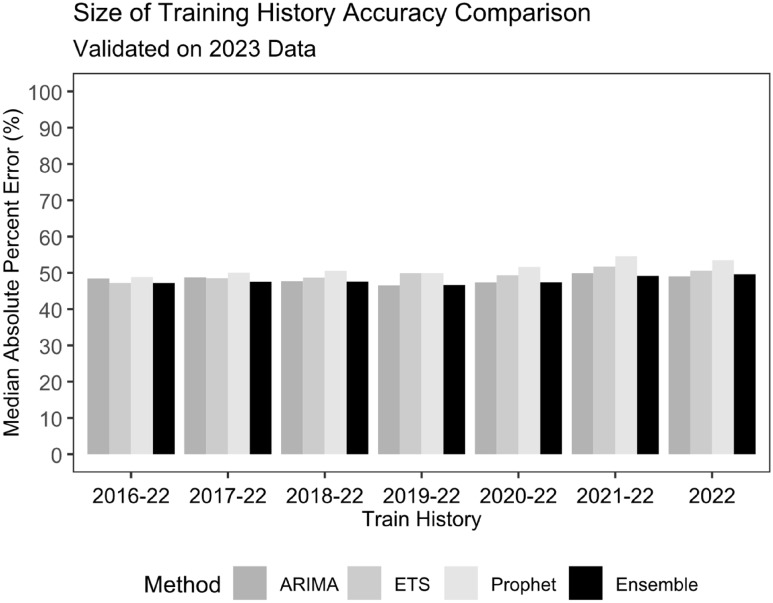
Methods: Daily hospitalizations for asthma were collected at Cincinnati Children's from January 1, 2016, to December 31, 2023. We evaluated Autoregressive Integrated Moving Average (ARIMA), Exponential Smoothing (ETS), Prophet, and Ensemble models to forecast next-day asthma hospitalizations validated on 2023 data, considering varying historical training data lengths. Forecasts were calibrated to identify days exceeding a 5% high-risk threshold of historical totals and considered multiple validation years and years before and during the COVID-19 pandemic.
Results: A total of 5,593 hospital admissions were recorded for asthma. Over 2,922 days, 166 days met the 5% high-risk threshold equating to 6 or more admissions. The Ensemble (Median Absolute Percentage Error (MAPE): 46.7%; Positive Predictive Value (PPV): 0.278; Negative Predictive Value (NPV): 0.942; Area Under the ROC Curve (AUC): 0.740; Sensitivity: 0.800; Specificity: 0.656) model achieved higher accuracy of high-risk days than ARIMA (MAPE: 46.5%; PPV: 0.278; NPV: 0.942; AUC: 0.709; Sensitivity: 0.760; Specificity: 0.571), ETS (MAPE: 47.2%; PPV: 0.222; NPV: 0.939; AUC: 0.711; Sensitivity: 0.800; Specificity: 0.668), and Prophet (MAPE: 48.9%; PPV: 0.444; NPV: 0.951; AUC: 0.732; Sensitivity: 0.680; Specificity: 0.741) models.
Conclusions: Our Ensemble model of mean predictions from ARIMA, ETS, and Prophet models was the most accurate in forecasting future asthma hospitalizations. Integrating forecasting techniques with clinical operations could enable proactive prevention through enhanced population care management.


 求助内容:
求助内容: 应助结果提醒方式:


