结合MCDM和地理空间技术确定地下水潜在带和趋势分析降雨和井水水位数据:在Prayagraj和Kaushambi地区的调查
引用次数: 0
摘要
本研究利用遥感和地理信息系统(GIS)计算出印度北方邦Prayagraj和Kaushambi地区的地下水潜力区(GWPZ),这些地区的地下水被农业和城市化严重开采,政府正在实施提高地下水位的政策。研究区既有承压和无承压两种类型的地下水。利用以下变量生成地下水潜势带(GWPZ)图:地质、降水、地貌、土壤质地、线条频率、坡度、排水密度、地形湿度指数(TWI)、土地利用和土地覆盖以及归一化植被指数(NDVI)。在层融合之前,进行多重共线性评估以确定预测结果的准确性。将选择的主题纳入加权线性组合的GIS平台,并通过多影响因素(MIF)和层次分析法(AHP)方法为不同主题分配不同的权重。根据地下水远景区划分,将研究区划分为高远景区、中远景区和低远景区。MIF法依次识别出高(16.35%,1173.79 km2)、中(76.28%,5477.24 km2)、低(7.38%,529.64 km2)、AHP法依次识别出高(10.01%,717.87 km2)、中(80.92%,5810.41 km2)、低(9.09%,652.40 km2)。通过使用接收机的工作特征曲线(ROC)将其与井水水位数据进行比较,确定了地图的准确性。AHP和MIF方法的准确率分别为79.9%和77%。根据34年降水和26年井水位的趋势分析,季风后和季风前的降水呈增加趋势,地下水位呈下降趋势。GWPZ评估和监测技术准确、公正。因此,这项研究对于建立一个更有效的框架至关重要,该框架可以加快地下水补给分析并指导人工补给结构的安装。本文章由计算机程序翻译,如有差异,请以英文原文为准。
Combining MCDM and geospatial techniques to identify groundwater potential zones and trend analysis of rainfall and well water level data: An investigation in the Prayagraj and Kaushambi districts
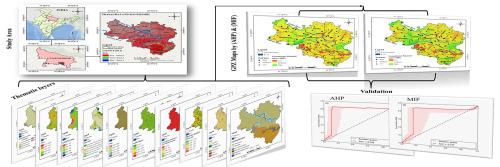
This research employed remote sensing and geographic information system (GIS) to figure out the groundwater potential zones (GWPZ) in the Prayagraj and Kaushambi districts of Uttar Pradesh, India, where groundwater is heavily exploited for agriculture and urbanisation and government policies being implemented for enhancing the groundwater level. The study region contains both (confined and unconfined) type of groundwater. The following variables were utilised to produce groundwater potential zone (GWPZ) maps: geology, precipitation, geomorphology, soil texture, lineament frequency, slope, drainage density, topographic wetness index (TWI), land use and land cover and normalised difference vegetation index (NDVI).
Prior to the fusion of the layers, multicollinearity assessments were performed to ascertain the accuracy of the predictive outcome. The chosen themes were included into a GIS platform with a weighted linear combination, with distinct weights allocated to different themes through the multi-influencing factor (MIF) and analytical hierarchy process (AHP) methodologies. Based on the groundwater prospective zones, the research area was divided into three groups: high potential, moderate potential, and low potential zones. Groundwater potential zones are sequentially identified by the MIF method as follows: High (16.35%; 1173.79 km2), Moderate (76.28%; 5477.24 km2), and Low (7.38%; 529.64 km2), while the AHP method identifies the same zones as follows: High (10.01%; 717.87 km2), Moderate (80.92%; 5810.41 km2), and Low (9.09%; 652.40 km2) in a consecutive manner. The accuracy of the maps was determined by comparing them to well water level data using the receivers operating characteristic curve (ROC). The AHP and MIF approaches yielded accuracy rates of 79.9% and 77% respectively. According to the trend analysis of rainfall for 34 years and water level of wells of 26 years for post-monsoon and pre-monsoon season the rainfall is increasing and groundwater level is decreasing. The GWPZ assessment and monitoring techniques are accurate and fair. Thus, this research is essential for creating a more efficient framework that can speed up groundwater recharge analysis and guide the installation of artificial recharge structures.
求助全文
通过发布文献求助,成功后即可免费获取论文全文。
去求助

 求助内容:
求助内容: 应助结果提醒方式:


