Jing-Jing Wang, Jie Hu, Yi-Fan Xu, Wu Dai, Jun-Cang Wu, Yong-Hong Cao
{"title":"绝经后2型糖尿病妇女骨质疏松预测模型的建立与验证:一项回顾性研究。","authors":"Jing-Jing Wang, Jie Hu, Yi-Fan Xu, Wu Dai, Jun-Cang Wu, Yong-Hong Cao","doi":"10.2147/DMSO.S524654","DOIUrl":null,"url":null,"abstract":"<p><strong>Aim: </strong>To investigate the correlation between blood biomarkers and blood glucose fluctuations with the risk of osteoporosis (OP) in postmenopausal women with type 2 diabetes mellitus (T2DM), and to construct a predictive nomogram for OP.</p><p><strong>Methods: </strong>Based on bone mineral density (BMD) results from dual-energy X-ray absorptiometry (DXA), participants were divided into OP (BMD T-value ≤ -2.5 SD) and Non-OP (BMD T-value > -2.5 SD) groups. Logistic analysis were used to explore the potential risk factors, following by the construction of a nomogram to predict the risk of OP. The discrimination and calibration of the nomogram were evaluated using concordance index (C-index), area under curve (AUC), and calibration curves.</p><p><strong>Results: </strong>We finally included 381 participants, with 147 in the OP group. Correlation analysis revealed a significant positive correlation between age and SII, and a negative correlation between BMI and CV. SII and CV demonstrated a positive dose-response relationship with OP, while FT3 exhibited a negative relationship. Multivariate logistic analysis showed that age (OR=1.088, 95% CI 1.052-1.125, P<0.001), BMI (OR=0.772, 95% CI 0.702-0.848, P<0.001), SII (OR=1.004, 95% CI 1.003-1.005, P<0.001), FT3 (OR=0.529, 95% CI 0.280-0.998, P=0.049), and CV (OR=1.051, 95% CI 1.007-1.097, P=0.022) were independent risk factors. The subgroup analysis showed the correlation between SII and OP occurred primarily in individuals aged ≥60 years. A predictive nomogram model was constructed based on age, BMI, SII, FT3, and CV, with a C-index of 0.842 (range 0.801-0.883). Decision Curve Analysis (DCA) demonstrated good clinical fit of the model.</p><p><strong>Conclusion: </strong>SII can predict the OP occurrence in women aged ≥60 years, while FT3 is applicable for predicting OP in women aged ≥70 years and those with a BMI <24 kg/m². The predictive nomogram demonstrated great predictive value in postmenopausal women with T2DM.</p>","PeriodicalId":11116,"journal":{"name":"Diabetes, Metabolic Syndrome and Obesity: Targets and Therapy","volume":"18 ","pages":"3363-3373"},"PeriodicalIF":3.0000,"publicationDate":"2025-09-09","publicationTypes":"Journal Article","fieldsOfStudy":null,"isOpenAccess":false,"openAccessPdf":"https://www.ncbi.nlm.nih.gov/pmc/articles/PMC12433205/pdf/","citationCount":"0","resultStr":"{\"title\":\"Establishment and Validation of a Predictive Nomogram Model for Osteoporosis in Postmenopausal Women with Type 2 Diabetes Mellitus: A Retrospective Study.\",\"authors\":\"Jing-Jing Wang, Jie Hu, Yi-Fan Xu, Wu Dai, Jun-Cang Wu, Yong-Hong Cao\",\"doi\":\"10.2147/DMSO.S524654\",\"DOIUrl\":null,\"url\":null,\"abstract\":\"<p><strong>Aim: </strong>To investigate the correlation between blood biomarkers and blood glucose fluctuations with the risk of osteoporosis (OP) in postmenopausal women with type 2 diabetes mellitus (T2DM), and to construct a predictive nomogram for OP.</p><p><strong>Methods: </strong>Based on bone mineral density (BMD) results from dual-energy X-ray absorptiometry (DXA), participants were divided into OP (BMD T-value ≤ -2.5 SD) and Non-OP (BMD T-value > -2.5 SD) groups. Logistic analysis were used to explore the potential risk factors, following by the construction of a nomogram to predict the risk of OP. The discrimination and calibration of the nomogram were evaluated using concordance index (C-index), area under curve (AUC), and calibration curves.</p><p><strong>Results: </strong>We finally included 381 participants, with 147 in the OP group. Correlation analysis revealed a significant positive correlation between age and SII, and a negative correlation between BMI and CV. SII and CV demonstrated a positive dose-response relationship with OP, while FT3 exhibited a negative relationship. Multivariate logistic analysis showed that age (OR=1.088, 95% CI 1.052-1.125, P<0.001), BMI (OR=0.772, 95% CI 0.702-0.848, P<0.001), SII (OR=1.004, 95% CI 1.003-1.005, P<0.001), FT3 (OR=0.529, 95% CI 0.280-0.998, P=0.049), and CV (OR=1.051, 95% CI 1.007-1.097, P=0.022) were independent risk factors. The subgroup analysis showed the correlation between SII and OP occurred primarily in individuals aged ≥60 years. A predictive nomogram model was constructed based on age, BMI, SII, FT3, and CV, with a C-index of 0.842 (range 0.801-0.883). Decision Curve Analysis (DCA) demonstrated good clinical fit of the model.</p><p><strong>Conclusion: </strong>SII can predict the OP occurrence in women aged ≥60 years, while FT3 is applicable for predicting OP in women aged ≥70 years and those with a BMI <24 kg/m². The predictive nomogram demonstrated great predictive value in postmenopausal women with T2DM.</p>\",\"PeriodicalId\":11116,\"journal\":{\"name\":\"Diabetes, Metabolic Syndrome and Obesity: Targets and Therapy\",\"volume\":\"18 \",\"pages\":\"3363-3373\"},\"PeriodicalIF\":3.0000,\"publicationDate\":\"2025-09-09\",\"publicationTypes\":\"Journal Article\",\"fieldsOfStudy\":null,\"isOpenAccess\":false,\"openAccessPdf\":\"https://www.ncbi.nlm.nih.gov/pmc/articles/PMC12433205/pdf/\",\"citationCount\":\"0\",\"resultStr\":null,\"platform\":\"Semanticscholar\",\"paperid\":null,\"PeriodicalName\":\"Diabetes, Metabolic Syndrome and Obesity: Targets and Therapy\",\"FirstCategoryId\":\"3\",\"ListUrlMain\":\"https://doi.org/10.2147/DMSO.S524654\",\"RegionNum\":3,\"RegionCategory\":\"医学\",\"ArticlePicture\":[],\"TitleCN\":null,\"AbstractTextCN\":null,\"PMCID\":null,\"EPubDate\":\"2025/1/1 0:00:00\",\"PubModel\":\"eCollection\",\"JCR\":\"Q3\",\"JCRName\":\"ENDOCRINOLOGY & METABOLISM\",\"Score\":null,\"Total\":0}","platform":"Semanticscholar","paperid":null,"PeriodicalName":"Diabetes, Metabolic Syndrome and Obesity: Targets and Therapy","FirstCategoryId":"3","ListUrlMain":"https://doi.org/10.2147/DMSO.S524654","RegionNum":3,"RegionCategory":"医学","ArticlePicture":[],"TitleCN":null,"AbstractTextCN":null,"PMCID":null,"EPubDate":"2025/1/1 0:00:00","PubModel":"eCollection","JCR":"Q3","JCRName":"ENDOCRINOLOGY & METABOLISM","Score":null,"Total":0}
引用次数: 0
摘要
目的:探讨绝经后2型糖尿病(T2DM)妇女血液生物标志物及血糖波动与骨质疏松(OP)风险的相关性,并构建骨质疏松(OP)的预测nomogram。方法:根据双能x线骨密度(BMD)测定结果,将受试者分为OP组(骨密度t值≤-2.5 SD)和Non-OP组(骨密度t值> -2.5 SD)。采用Logistic分析方法探讨潜在危险因素,构建预测op风险的nomogram。采用一致性指数(C-index)、曲线下面积(AUC)和校正曲线对nomogram进行判别和校正。结果:我们最终纳入381例受试者,其中OP组147例。相关分析显示年龄与SII呈显著正相关,BMI与CV呈显著负相关。SII和CV与OP呈正相关,FT3呈负相关。多因素logistic分析显示年龄(OR=1.088, 95% CI 1.052 ~ 1.125)。结论:SII可预测≥60岁女性OP的发生,FT3适用于预测≥70岁及有BMI的女性OP的发生
Establishment and Validation of a Predictive Nomogram Model for Osteoporosis in Postmenopausal Women with Type 2 Diabetes Mellitus: A Retrospective Study.
Aim: To investigate the correlation between blood biomarkers and blood glucose fluctuations with the risk of osteoporosis (OP) in postmenopausal women with type 2 diabetes mellitus (T2DM), and to construct a predictive nomogram for OP.
Methods: Based on bone mineral density (BMD) results from dual-energy X-ray absorptiometry (DXA), participants were divided into OP (BMD T-value ≤ -2.5 SD) and Non-OP (BMD T-value > -2.5 SD) groups. Logistic analysis were used to explore the potential risk factors, following by the construction of a nomogram to predict the risk of OP. The discrimination and calibration of the nomogram were evaluated using concordance index (C-index), area under curve (AUC), and calibration curves.
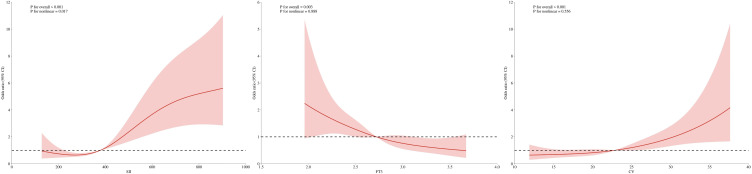
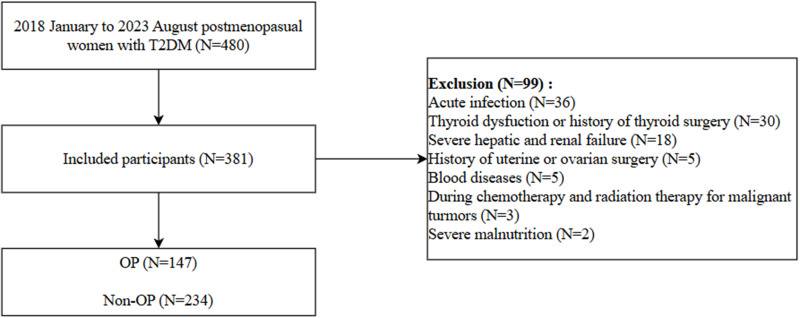
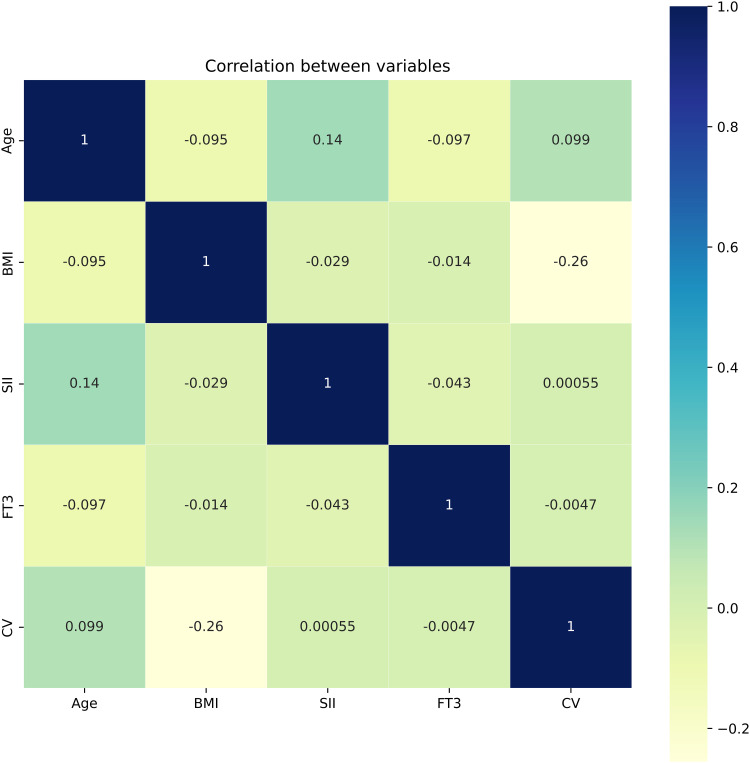
Results: We finally included 381 participants, with 147 in the OP group. Correlation analysis revealed a significant positive correlation between age and SII, and a negative correlation between BMI and CV. SII and CV demonstrated a positive dose-response relationship with OP, while FT3 exhibited a negative relationship. Multivariate logistic analysis showed that age (OR=1.088, 95% CI 1.052-1.125, P<0.001), BMI (OR=0.772, 95% CI 0.702-0.848, P<0.001), SII (OR=1.004, 95% CI 1.003-1.005, P<0.001), FT3 (OR=0.529, 95% CI 0.280-0.998, P=0.049), and CV (OR=1.051, 95% CI 1.007-1.097, P=0.022) were independent risk factors. The subgroup analysis showed the correlation between SII and OP occurred primarily in individuals aged ≥60 years. A predictive nomogram model was constructed based on age, BMI, SII, FT3, and CV, with a C-index of 0.842 (range 0.801-0.883). Decision Curve Analysis (DCA) demonstrated good clinical fit of the model.
Conclusion: SII can predict the OP occurrence in women aged ≥60 years, while FT3 is applicable for predicting OP in women aged ≥70 years and those with a BMI <24 kg/m². The predictive nomogram demonstrated great predictive value in postmenopausal women with T2DM.
期刊介绍:
An international, peer-reviewed, open access, online journal. The journal is committed to the rapid publication of the latest laboratory and clinical findings in the fields of diabetes, metabolic syndrome and obesity research. Original research, review, case reports, hypothesis formation, expert opinion and commentaries are all considered for publication.

 求助内容:
求助内容: 应助结果提醒方式:


