溶解分布的比较:不同f2估计器的90%置信区间,使用自提方法与非标准化期望值(EDNE)值的欧几里得距离。
IF 4.3
2区 医学
Q1 PHARMACOLOGY & PHARMACY
European Journal of Pharmaceutics and Biopharmaceutics
Pub Date : 2025-08-26
DOI:10.1016/j.ejpb.2025.114839
引用次数: 0
摘要
比较溶出度分布最常用的方法是相似因子f2法。当应用f2方法的法规要求未得到满足时,应使用替代方法。在目前的研究中,比较了两种常用的方法,即使用bootstrap方法的不同f2估计量的90%置信区间(CI)和非标准化期望值(EDNE)值的欧几里得距离(Euclidean Distance)。对于第一种方法,参考种群和检验种群分布基于不同目标种群f2值、可变性和样本量的多变量正态分布进行模拟。对于每对随机模拟的剖面,计算各种f2估计值的90% CI和EDNE值。对于第二种方法,基于一级释放模型的模拟,为具有不同可变性和预定义目标群体f2值的参考和测试群体模拟了100万个个体溶出曲线,从这些群体中随机抽取不同大小的样本,以获得相同f2估计值和EDNE值的90% CI。对两种方法重复整个过程10000次,通过计算溶出谱相似的重复的百分比来评估方法的I型误差和统计能力。当测试概要和参考概要的真实总体不相似时,该相似百分比表示类型I误差;当测试概要和参考概要的真实总体相似时,该百分比表示统计能力。结果表明,EDNE方法具有比bootstrap f2方法高得多的统计能力,但相关的I型误差也高得令人无法接受,使其不适合监管采用。最好的方法是预期f2的90% CI,因此,推荐使用该方法。此外,在使用自举方法时,样本量应该增加,以考虑到低统计功率。本文章由计算机程序翻译,如有差异,请以英文原文为准。
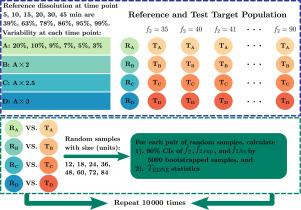
Comparison of dissolution profiles: 90 % confidence intervals of different f2 estimators using bootstrap methodology versus the Euclidean Distance of the Non-standardized Expected (EDNE) values
The most widely used method to compare dissolution profiles is the similarity factor method. When the regulatory requirements to apply the method are not fulfilled, alternative methods should be used. In the current study two commonly used methods, 90 % confidence intervals (CI) of different estimators using bootstrap methodology and the Euclidean Distance of the Non-standardized Expected (EDNE) values, are compared using two different simulation approaches. For the first approach, the reference and test population profiles were simulated based on the multivariate normal distribution with different target population values, variability, and sample sizes. For each pair of randomly simulated profiles, 90 % CI of various estimators and the EDNE values were calculated. For the second approach, the first-order release model-based simulation, one million individual dissolution profiles were simulated for the reference and test populations with different variability and predefined target population values, random samples of different sizes were taken from those populations to obtain 90 % CI of the same estimators and the EDNE values. The whole process was repeated 10 000 times for both approaches to evaluate the type I error and statistical power of the methods by calculating the percentages of replicates where the dissolution profiles are similar. When the true populations of test and reference profiles are not similar, this percentage of similarity represents the type I error; when the true populations of test and reference profiles are similar, this percentage represents the statistical power. The results shows that the EDNE method has much higher statistical power than the bootstrap methods, but the associated type I errors are also unacceptably higher, making it unsuitable for regulatory adoption. The best method is the 90 % CI of the expected , therefore, this method is recommended. In addition, sample sizes should be increased to account for the low statistical power when using bootstrap methods.
求助全文
通过发布文献求助,成功后即可免费获取论文全文。
去求助
来源期刊
CiteScore
8.80
自引率
4.10%
发文量
211
审稿时长
36 days
期刊介绍:
The European Journal of Pharmaceutics and Biopharmaceutics provides a medium for the publication of novel, innovative and hypothesis-driven research from the areas of Pharmaceutics and Biopharmaceutics.
Topics covered include for example:
Design and development of drug delivery systems for pharmaceuticals and biopharmaceuticals (small molecules, proteins, nucleic acids)
Aspects of manufacturing process design
Biomedical aspects of drug product design
Strategies and formulations for controlled drug transport across biological barriers
Physicochemical aspects of drug product development
Novel excipients for drug product design
Drug delivery and controlled release systems for systemic and local applications
Nanomaterials for therapeutic and diagnostic purposes
Advanced therapy medicinal products
Medical devices supporting a distinct pharmacological effect.
 求助内容:
求助内容: 应助结果提醒方式:


