Glodi Mutamba, Callyn Wren, Dipen Patel, Melphine Harriott, Christopher Evans
{"title":"2017-2023年田纳西州全国NHSN抗菌药物使用率及标准化给药比分析","authors":"Glodi Mutamba, Callyn Wren, Dipen Patel, Melphine Harriott, Christopher Evans","doi":"10.1017/ash.2025.10083","DOIUrl":null,"url":null,"abstract":"<p><strong>Objective: </strong>To describe antimicrobial use in Tennessee from 2017 to 2023.</p><p><strong>Design: </strong>Retrospective analysis of antimicrobial use using data from the National Healthcare Safety Network (NHSN) Antimicrobial Use (AU) Option.</p><p><strong>Setting: </strong>Acute care and critical access facilities in Tennessee.</p><p><strong>Results: </strong>From 2017 to 2023, 97 facilities in Tennessee submitted data to the NHSN AU Option. The number of reporting facilities increased from 25 to 95. During this time, the statewide average antimicrobial use significantly rose from 593 days of therapy (DOT)/1000 days present (DP) to 621 DOT/1000 DP (<i>P</i> = .0478). The All-Antibacterial Standardized Antimicrobial Administration Ratio (SAAR) values remained near 1.0, indicating overall use was as predicted. However, the All-Antibacterial SAAR values, particularly in small facilities, revealed that they utilized antibiotic agents more than predicted during the study period. Additionally, the SAAR trends varied by patient care locations, with the oncology unit (ONC) experiencing a significant increase from 0.73 to 1.12 (<i>P</i>-value<.0001). West Tennessee had the highest antimicrobial use rate at 736 DOT per 1000 DP, and an All-Antibacterial SAAR of 1.21. The top antimicrobial agents-vancomycin, ceftriaxone, piperacillin/tazobactam, cefepime, and cefazolin-accounted for 54% of the total antimicrobial use.</p><p><strong>Conclusions: </strong>This statewide analysis of AU and SAAR trends identifies areas where additional antimicrobial stewardship efforts may be targeted to improve antimicrobial use. Facilities of different sizes and geographic locations have unique demographics that can affect antimicrobial use, requiring specialized antimicrobial stewardship techniques.</p>","PeriodicalId":72246,"journal":{"name":"Antimicrobial stewardship & healthcare epidemiology : ASHE","volume":"5 1","pages":"e181"},"PeriodicalIF":0.0000,"publicationDate":"2025-08-07","publicationTypes":"Journal Article","fieldsOfStudy":null,"isOpenAccess":false,"openAccessPdf":"https://www.ncbi.nlm.nih.gov/pmc/articles/PMC12345046/pdf/","citationCount":"0","resultStr":"{\"title\":\"Statewide analysis of NHSN antimicrobial use rate and standardized antimicrobial administration ratio (SAAR) 2017-2023, Tennessee.\",\"authors\":\"Glodi Mutamba, Callyn Wren, Dipen Patel, Melphine Harriott, Christopher Evans\",\"doi\":\"10.1017/ash.2025.10083\",\"DOIUrl\":null,\"url\":null,\"abstract\":\"<p><strong>Objective: </strong>To describe antimicrobial use in Tennessee from 2017 to 2023.</p><p><strong>Design: </strong>Retrospective analysis of antimicrobial use using data from the National Healthcare Safety Network (NHSN) Antimicrobial Use (AU) Option.</p><p><strong>Setting: </strong>Acute care and critical access facilities in Tennessee.</p><p><strong>Results: </strong>From 2017 to 2023, 97 facilities in Tennessee submitted data to the NHSN AU Option. The number of reporting facilities increased from 25 to 95. During this time, the statewide average antimicrobial use significantly rose from 593 days of therapy (DOT)/1000 days present (DP) to 621 DOT/1000 DP (<i>P</i> = .0478). The All-Antibacterial Standardized Antimicrobial Administration Ratio (SAAR) values remained near 1.0, indicating overall use was as predicted. However, the All-Antibacterial SAAR values, particularly in small facilities, revealed that they utilized antibiotic agents more than predicted during the study period. Additionally, the SAAR trends varied by patient care locations, with the oncology unit (ONC) experiencing a significant increase from 0.73 to 1.12 (<i>P</i>-value<.0001). West Tennessee had the highest antimicrobial use rate at 736 DOT per 1000 DP, and an All-Antibacterial SAAR of 1.21. The top antimicrobial agents-vancomycin, ceftriaxone, piperacillin/tazobactam, cefepime, and cefazolin-accounted for 54% of the total antimicrobial use.</p><p><strong>Conclusions: </strong>This statewide analysis of AU and SAAR trends identifies areas where additional antimicrobial stewardship efforts may be targeted to improve antimicrobial use. Facilities of different sizes and geographic locations have unique demographics that can affect antimicrobial use, requiring specialized antimicrobial stewardship techniques.</p>\",\"PeriodicalId\":72246,\"journal\":{\"name\":\"Antimicrobial stewardship & healthcare epidemiology : ASHE\",\"volume\":\"5 1\",\"pages\":\"e181\"},\"PeriodicalIF\":0.0000,\"publicationDate\":\"2025-08-07\",\"publicationTypes\":\"Journal Article\",\"fieldsOfStudy\":null,\"isOpenAccess\":false,\"openAccessPdf\":\"https://www.ncbi.nlm.nih.gov/pmc/articles/PMC12345046/pdf/\",\"citationCount\":\"0\",\"resultStr\":null,\"platform\":\"Semanticscholar\",\"paperid\":null,\"PeriodicalName\":\"Antimicrobial stewardship & healthcare epidemiology : ASHE\",\"FirstCategoryId\":\"1085\",\"ListUrlMain\":\"https://doi.org/10.1017/ash.2025.10083\",\"RegionNum\":0,\"RegionCategory\":null,\"ArticlePicture\":[],\"TitleCN\":null,\"AbstractTextCN\":null,\"PMCID\":null,\"EPubDate\":\"2025/1/1 0:00:00\",\"PubModel\":\"eCollection\",\"JCR\":\"\",\"JCRName\":\"\",\"Score\":null,\"Total\":0}","platform":"Semanticscholar","paperid":null,"PeriodicalName":"Antimicrobial stewardship & healthcare epidemiology : ASHE","FirstCategoryId":"1085","ListUrlMain":"https://doi.org/10.1017/ash.2025.10083","RegionNum":0,"RegionCategory":null,"ArticlePicture":[],"TitleCN":null,"AbstractTextCN":null,"PMCID":null,"EPubDate":"2025/1/1 0:00:00","PubModel":"eCollection","JCR":"","JCRName":"","Score":null,"Total":0}
Statewide analysis of NHSN antimicrobial use rate and standardized antimicrobial administration ratio (SAAR) 2017-2023, Tennessee.
Objective: To describe antimicrobial use in Tennessee from 2017 to 2023.
Design: Retrospective analysis of antimicrobial use using data from the National Healthcare Safety Network (NHSN) Antimicrobial Use (AU) Option.
Setting: Acute care and critical access facilities in Tennessee.
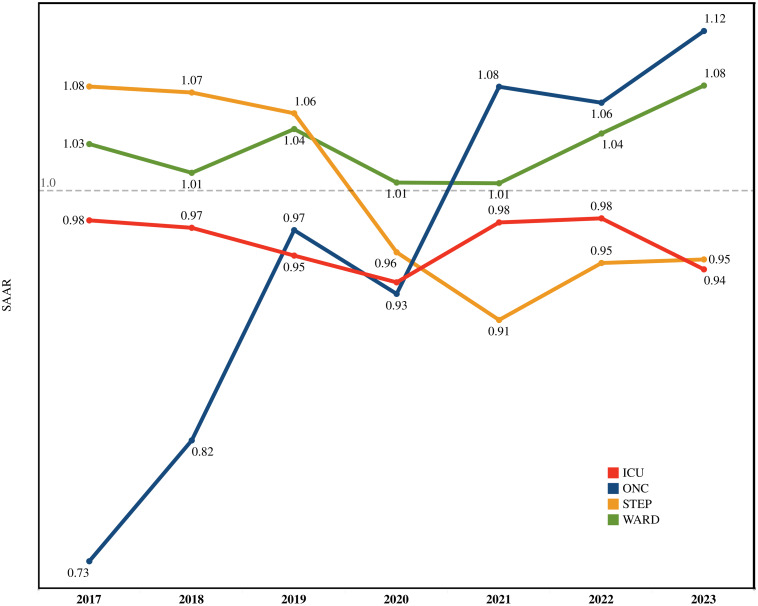
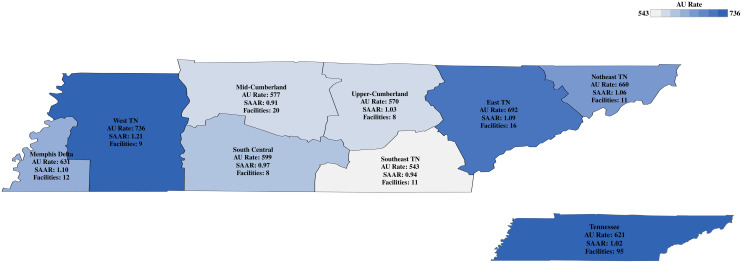
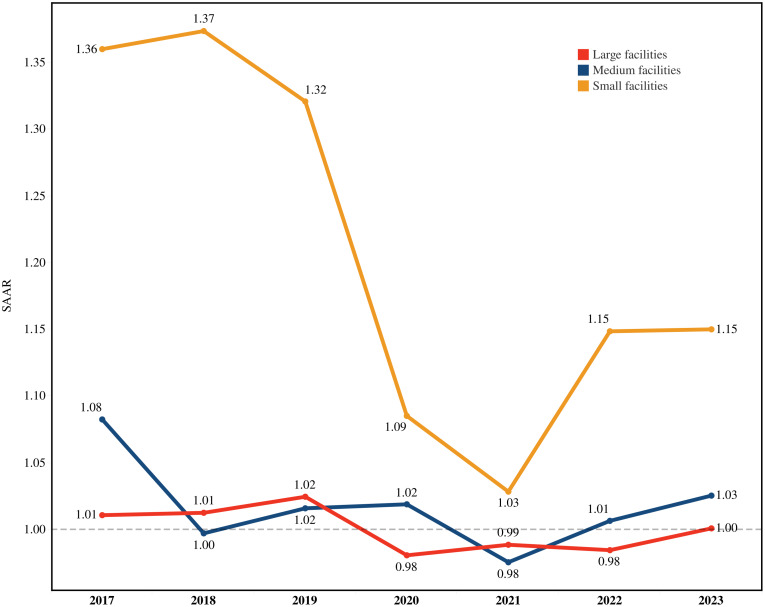
Results: From 2017 to 2023, 97 facilities in Tennessee submitted data to the NHSN AU Option. The number of reporting facilities increased from 25 to 95. During this time, the statewide average antimicrobial use significantly rose from 593 days of therapy (DOT)/1000 days present (DP) to 621 DOT/1000 DP (P = .0478). The All-Antibacterial Standardized Antimicrobial Administration Ratio (SAAR) values remained near 1.0, indicating overall use was as predicted. However, the All-Antibacterial SAAR values, particularly in small facilities, revealed that they utilized antibiotic agents more than predicted during the study period. Additionally, the SAAR trends varied by patient care locations, with the oncology unit (ONC) experiencing a significant increase from 0.73 to 1.12 (P-value<.0001). West Tennessee had the highest antimicrobial use rate at 736 DOT per 1000 DP, and an All-Antibacterial SAAR of 1.21. The top antimicrobial agents-vancomycin, ceftriaxone, piperacillin/tazobactam, cefepime, and cefazolin-accounted for 54% of the total antimicrobial use.
Conclusions: This statewide analysis of AU and SAAR trends identifies areas where additional antimicrobial stewardship efforts may be targeted to improve antimicrobial use. Facilities of different sizes and geographic locations have unique demographics that can affect antimicrobial use, requiring specialized antimicrobial stewardship techniques.

 求助内容:
求助内容: 应助结果提醒方式:


