{"title":"Na+//Cl -, SO42 -, SeO32—H2O四元体系在298.15 K和323.15 K下的固液平衡","authors":"Xueying Wang*, Qingyuan Wu, Wenyan Zheng, Yonghe Zhang, Meiyan Zhang and Xueli Huang, ","doi":"10.1021/acs.jced.5c00282","DOIUrl":null,"url":null,"abstract":"<p >The solubility data of the quaternary system Na<sup>+</sup>//Cl<sup>–</sup>, SO<sub>4</sub><sup>2–</sup>, SeO<sub>3</sub><sup>2–</sup>–H<sub>2</sub>O at 298.15 and 323.15 K were determined using the isothermal solution equilibrium method. On the basis of the measured data, a stereoscopic phase diagram, dry salt projection diagram, and water content diagram were constructed. The results show that the phase diagrams of the quaternary system Na<sup>+</sup>//Cl<sup>–</sup>, SO<sub>4</sub><sup>2–</sup>, SeO<sub>3</sub><sup>2–</sup>–H<sub>2</sub>O at 298.15 and 323.15 K differ significantly. At 298.15 K, the phase diagram includes one invariant point, four univariate curves, and four crystallization zones, corresponding to the four single salts Na<sub>2</sub>SO<sub>4</sub>·10H<sub>2</sub>O, Na<sub>2</sub>SO<sub>4</sub>, NaCl, and Na<sub>2</sub>SeO<sub>3</sub>. In contrast, the phase diagram at 323.15 K includes one invariant point, three univariate curves, and three crystallization zones, corresponding to Na<sub>2</sub>SO<sub>4</sub>, NaCl, and Na<sub>2</sub>SeO<sub>3</sub>. Comparative analysis of the phase diagrams at both temperatures reveals that with rising temperature, the crystallization areas of Na<sub>2</sub>SO<sub>4</sub> and Na<sub>2</sub>SeO<sub>3</sub> expand, whereas that of NaCl decreases.</p>","PeriodicalId":42,"journal":{"name":"Journal of Chemical & Engineering Data","volume":"70 8","pages":"3436–3443"},"PeriodicalIF":2.1000,"publicationDate":"2025-07-10","publicationTypes":"Journal Article","fieldsOfStudy":null,"isOpenAccess":false,"openAccessPdf":"","citationCount":"0","resultStr":"{\"title\":\"Solid-Liquid Phase Equilibria of the Quaternary System Na+//Cl–, SO42–, SeO32––H2O at 298.15 and 323.15 K\",\"authors\":\"Xueying Wang*, Qingyuan Wu, Wenyan Zheng, Yonghe Zhang, Meiyan Zhang and Xueli Huang, \",\"doi\":\"10.1021/acs.jced.5c00282\",\"DOIUrl\":null,\"url\":null,\"abstract\":\"<p >The solubility data of the quaternary system Na<sup>+</sup>//Cl<sup>–</sup>, SO<sub>4</sub><sup>2–</sup>, SeO<sub>3</sub><sup>2–</sup>–H<sub>2</sub>O at 298.15 and 323.15 K were determined using the isothermal solution equilibrium method. On the basis of the measured data, a stereoscopic phase diagram, dry salt projection diagram, and water content diagram were constructed. The results show that the phase diagrams of the quaternary system Na<sup>+</sup>//Cl<sup>–</sup>, SO<sub>4</sub><sup>2–</sup>, SeO<sub>3</sub><sup>2–</sup>–H<sub>2</sub>O at 298.15 and 323.15 K differ significantly. At 298.15 K, the phase diagram includes one invariant point, four univariate curves, and four crystallization zones, corresponding to the four single salts Na<sub>2</sub>SO<sub>4</sub>·10H<sub>2</sub>O, Na<sub>2</sub>SO<sub>4</sub>, NaCl, and Na<sub>2</sub>SeO<sub>3</sub>. In contrast, the phase diagram at 323.15 K includes one invariant point, three univariate curves, and three crystallization zones, corresponding to Na<sub>2</sub>SO<sub>4</sub>, NaCl, and Na<sub>2</sub>SeO<sub>3</sub>. Comparative analysis of the phase diagrams at both temperatures reveals that with rising temperature, the crystallization areas of Na<sub>2</sub>SO<sub>4</sub> and Na<sub>2</sub>SeO<sub>3</sub> expand, whereas that of NaCl decreases.</p>\",\"PeriodicalId\":42,\"journal\":{\"name\":\"Journal of Chemical & Engineering Data\",\"volume\":\"70 8\",\"pages\":\"3436–3443\"},\"PeriodicalIF\":2.1000,\"publicationDate\":\"2025-07-10\",\"publicationTypes\":\"Journal Article\",\"fieldsOfStudy\":null,\"isOpenAccess\":false,\"openAccessPdf\":\"\",\"citationCount\":\"0\",\"resultStr\":null,\"platform\":\"Semanticscholar\",\"paperid\":null,\"PeriodicalName\":\"Journal of Chemical & Engineering Data\",\"FirstCategoryId\":\"1\",\"ListUrlMain\":\"https://pubs.acs.org/doi/10.1021/acs.jced.5c00282\",\"RegionNum\":3,\"RegionCategory\":\"工程技术\",\"ArticlePicture\":[],\"TitleCN\":null,\"AbstractTextCN\":null,\"PMCID\":null,\"EPubDate\":\"\",\"PubModel\":\"\",\"JCR\":\"Q3\",\"JCRName\":\"CHEMISTRY, MULTIDISCIPLINARY\",\"Score\":null,\"Total\":0}","platform":"Semanticscholar","paperid":null,"PeriodicalName":"Journal of Chemical & Engineering Data","FirstCategoryId":"1","ListUrlMain":"https://pubs.acs.org/doi/10.1021/acs.jced.5c00282","RegionNum":3,"RegionCategory":"工程技术","ArticlePicture":[],"TitleCN":null,"AbstractTextCN":null,"PMCID":null,"EPubDate":"","PubModel":"","JCR":"Q3","JCRName":"CHEMISTRY, MULTIDISCIPLINARY","Score":null,"Total":0}
Solid-Liquid Phase Equilibria of the Quaternary System Na+//Cl–, SO42–, SeO32––H2O at 298.15 and 323.15 K
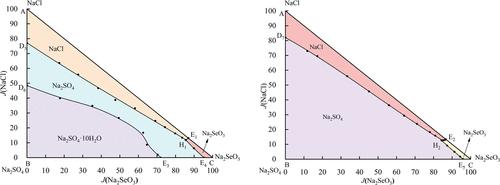
The solubility data of the quaternary system Na+//Cl–, SO42–, SeO32––H2O at 298.15 and 323.15 K were determined using the isothermal solution equilibrium method. On the basis of the measured data, a stereoscopic phase diagram, dry salt projection diagram, and water content diagram were constructed. The results show that the phase diagrams of the quaternary system Na+//Cl–, SO42–, SeO32––H2O at 298.15 and 323.15 K differ significantly. At 298.15 K, the phase diagram includes one invariant point, four univariate curves, and four crystallization zones, corresponding to the four single salts Na2SO4·10H2O, Na2SO4, NaCl, and Na2SeO3. In contrast, the phase diagram at 323.15 K includes one invariant point, three univariate curves, and three crystallization zones, corresponding to Na2SO4, NaCl, and Na2SeO3. Comparative analysis of the phase diagrams at both temperatures reveals that with rising temperature, the crystallization areas of Na2SO4 and Na2SeO3 expand, whereas that of NaCl decreases.
期刊介绍:
The Journal of Chemical & Engineering Data is a monthly journal devoted to the publication of data obtained from both experiment and computation, which are viewed as complementary. It is the only American Chemical Society journal primarily concerned with articles containing data on the phase behavior and the physical, thermodynamic, and transport properties of well-defined materials, including complex mixtures of known compositions. While environmental and biological samples are of interest, their compositions must be known and reproducible. As a result, adsorption on natural product materials does not generally fit within the scope of Journal of Chemical & Engineering Data.
 求助内容:
求助内容: 应助结果提醒方式:


