Viktorija Kesaite, Yanaina Chavez-Ugalde, Martin White, Jean Adams
{"title":"超加工食品与高脂肪、高盐或高糖食品之间的重叠:对2008/2009-2018/2019年英国国家饮食和营养调查年度11波的分析。","authors":"Viktorija Kesaite, Yanaina Chavez-Ugalde, Martin White, Jean Adams","doi":"10.1136/bmjnph-2024-001035","DOIUrl":null,"url":null,"abstract":"<p><p>While many countries use guidance and policies based on nutrients and food groups to support citizens to consume healthy diets, fewer have explicitly adopted the concept of ultra-processed foods (UPF). UPF consumption is associated with many adverse health outcomes in cohort studies. In the UK, a nutrient profiling model (NPM) is used to identify foods high in fat, salt or sugar (HFSS) and several policies target these. It is not known how well the NPM also captures UPF. We aimed to quantify the proportion of food and drink items consumed in the UK that are HFSS, UPF, both or neither and describe the food groups making the largest contributions to each category. We analysed data from the National Diet and Nutrition Survey, between 2008/2009 and 2018/2019, using descriptive statistics. We used three metrics of food consumption: all foods, percentage of energy in all foods (reflecting that different foods are consumed in different portion sizes and are of different energy densities) and percentage of food weight in all foods (reflecting that some UPFs have few calories but are consumed in large volumes). We found that 33.4% of foods, 47.4% of energy and 16.0% of food weight were HFSS; 36.2%, 59.8% and 32.9%, respectively, were UPFs; 20.1%, 35.1% and 12.6% were both and 50.5%, 27.9% and 63.7% were neither. In total, 55.6% of UPF foods, 58.7% of energy from UPFs and 38.3% of food weight from UPF consumed were also HFSS. The most common food groups contributing to foods that were UPF but not HFSS were low-calorie soft drinks and white bread. The UK NPM captures at best just over half of UPFs consumed in the UK. Expanding the NPM to include ingredients common in UPFs (eg, non-nutritive sweeteners, emulsifiers) would capture a larger percentage of UPFs and could incentivise 'deformulation' of UPF products.</p>","PeriodicalId":36307,"journal":{"name":"BMJ Nutrition, Prevention and Health","volume":"8 1","pages":"e001035"},"PeriodicalIF":2.5000,"publicationDate":"2025-03-28","publicationTypes":"Journal Article","fieldsOfStudy":null,"isOpenAccess":false,"openAccessPdf":"https://www.ncbi.nlm.nih.gov/pmc/articles/PMC12322569/pdf/","citationCount":"0","resultStr":"{\"title\":\"Overlap between ultra-processed food and food that is high in fat, salt or sugar: analysis of 11 annual waves of the UK National Diet and Nutrition Survey 2008/2009-2018/2019.\",\"authors\":\"Viktorija Kesaite, Yanaina Chavez-Ugalde, Martin White, Jean Adams\",\"doi\":\"10.1136/bmjnph-2024-001035\",\"DOIUrl\":null,\"url\":null,\"abstract\":\"<p><p>While many countries use guidance and policies based on nutrients and food groups to support citizens to consume healthy diets, fewer have explicitly adopted the concept of ultra-processed foods (UPF). UPF consumption is associated with many adverse health outcomes in cohort studies. In the UK, a nutrient profiling model (NPM) is used to identify foods high in fat, salt or sugar (HFSS) and several policies target these. It is not known how well the NPM also captures UPF. We aimed to quantify the proportion of food and drink items consumed in the UK that are HFSS, UPF, both or neither and describe the food groups making the largest contributions to each category. We analysed data from the National Diet and Nutrition Survey, between 2008/2009 and 2018/2019, using descriptive statistics. We used three metrics of food consumption: all foods, percentage of energy in all foods (reflecting that different foods are consumed in different portion sizes and are of different energy densities) and percentage of food weight in all foods (reflecting that some UPFs have few calories but are consumed in large volumes). We found that 33.4% of foods, 47.4% of energy and 16.0% of food weight were HFSS; 36.2%, 59.8% and 32.9%, respectively, were UPFs; 20.1%, 35.1% and 12.6% were both and 50.5%, 27.9% and 63.7% were neither. In total, 55.6% of UPF foods, 58.7% of energy from UPFs and 38.3% of food weight from UPF consumed were also HFSS. The most common food groups contributing to foods that were UPF but not HFSS were low-calorie soft drinks and white bread. The UK NPM captures at best just over half of UPFs consumed in the UK. Expanding the NPM to include ingredients common in UPFs (eg, non-nutritive sweeteners, emulsifiers) would capture a larger percentage of UPFs and could incentivise 'deformulation' of UPF products.</p>\",\"PeriodicalId\":36307,\"journal\":{\"name\":\"BMJ Nutrition, Prevention and Health\",\"volume\":\"8 1\",\"pages\":\"e001035\"},\"PeriodicalIF\":2.5000,\"publicationDate\":\"2025-03-28\",\"publicationTypes\":\"Journal Article\",\"fieldsOfStudy\":null,\"isOpenAccess\":false,\"openAccessPdf\":\"https://www.ncbi.nlm.nih.gov/pmc/articles/PMC12322569/pdf/\",\"citationCount\":\"0\",\"resultStr\":null,\"platform\":\"Semanticscholar\",\"paperid\":null,\"PeriodicalName\":\"BMJ Nutrition, Prevention and Health\",\"FirstCategoryId\":\"1085\",\"ListUrlMain\":\"https://doi.org/10.1136/bmjnph-2024-001035\",\"RegionNum\":0,\"RegionCategory\":null,\"ArticlePicture\":[],\"TitleCN\":null,\"AbstractTextCN\":null,\"PMCID\":null,\"EPubDate\":\"2025/1/1 0:00:00\",\"PubModel\":\"eCollection\",\"JCR\":\"Q2\",\"JCRName\":\"NUTRITION & DIETETICS\",\"Score\":null,\"Total\":0}","platform":"Semanticscholar","paperid":null,"PeriodicalName":"BMJ Nutrition, Prevention and Health","FirstCategoryId":"1085","ListUrlMain":"https://doi.org/10.1136/bmjnph-2024-001035","RegionNum":0,"RegionCategory":null,"ArticlePicture":[],"TitleCN":null,"AbstractTextCN":null,"PMCID":null,"EPubDate":"2025/1/1 0:00:00","PubModel":"eCollection","JCR":"Q2","JCRName":"NUTRITION & DIETETICS","Score":null,"Total":0}
Overlap between ultra-processed food and food that is high in fat, salt or sugar: analysis of 11 annual waves of the UK National Diet and Nutrition Survey 2008/2009-2018/2019.
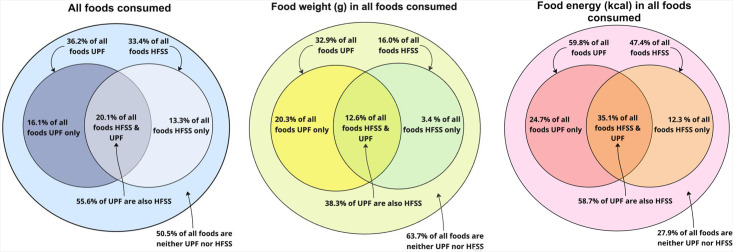
While many countries use guidance and policies based on nutrients and food groups to support citizens to consume healthy diets, fewer have explicitly adopted the concept of ultra-processed foods (UPF). UPF consumption is associated with many adverse health outcomes in cohort studies. In the UK, a nutrient profiling model (NPM) is used to identify foods high in fat, salt or sugar (HFSS) and several policies target these. It is not known how well the NPM also captures UPF. We aimed to quantify the proportion of food and drink items consumed in the UK that are HFSS, UPF, both or neither and describe the food groups making the largest contributions to each category. We analysed data from the National Diet and Nutrition Survey, between 2008/2009 and 2018/2019, using descriptive statistics. We used three metrics of food consumption: all foods, percentage of energy in all foods (reflecting that different foods are consumed in different portion sizes and are of different energy densities) and percentage of food weight in all foods (reflecting that some UPFs have few calories but are consumed in large volumes). We found that 33.4% of foods, 47.4% of energy and 16.0% of food weight were HFSS; 36.2%, 59.8% and 32.9%, respectively, were UPFs; 20.1%, 35.1% and 12.6% were both and 50.5%, 27.9% and 63.7% were neither. In total, 55.6% of UPF foods, 58.7% of energy from UPFs and 38.3% of food weight from UPF consumed were also HFSS. The most common food groups contributing to foods that were UPF but not HFSS were low-calorie soft drinks and white bread. The UK NPM captures at best just over half of UPFs consumed in the UK. Expanding the NPM to include ingredients common in UPFs (eg, non-nutritive sweeteners, emulsifiers) would capture a larger percentage of UPFs and could incentivise 'deformulation' of UPF products.

 求助内容:
求助内容: 应助结果提醒方式:


