Colin Dumont, Samuele Iesari, Pamela Baldin, Selda Aydin, Guillaume Henin, Marie Philippart, Eliano Bonaccorsi-Riani, Olga Ciccarelli, Laurent Coubeau, Hubert Piessevaux, Nicolas Lanthier, Géraldine Dahlqvist
{"title":"肝移植脂肪变性和肝纤维化的早期诊断:非侵入性检查能解决问题吗?","authors":"Colin Dumont, Samuele Iesari, Pamela Baldin, Selda Aydin, Guillaume Henin, Marie Philippart, Eliano Bonaccorsi-Riani, Olga Ciccarelli, Laurent Coubeau, Hubert Piessevaux, Nicolas Lanthier, Géraldine Dahlqvist","doi":"10.21037/tgh-24-131","DOIUrl":null,"url":null,"abstract":"<p><strong>Background: </strong>Graft steatosis and fibrosis detection is a challenge to avoid graft loss. The role of liver biopsy (LB) after liver transplantation (LT) is changing with the emergence of non-invasive tests. Our aim is to evaluate the accuracy of transient elastography (TE) in predicting steatosis and fibrosis post-LT.</p><p><strong>Methods: </strong>This prospective study was performed on 158 LT patients. Controlled attenuation parameter (CAP) and liver stiffness measurement (LSM) were carried out prior to LB. We built receiver operating characteristic (ROC) curves to evaluate the predictive performance of TE.</p><p><strong>Results: </strong>Using CAP, the area under the curve (AUC) were 0.872 [95% confidence interval (CI): 0.791-0.953, P=0.01] and 0.708 (95% CI: 0.614-0.801, P<0.001) for the diagnosis of steatosis ≥ S2 and ≥ S1, respectively. Using LSM, the AUC were 0.588 (95% CI: 0.486-0.691, P=0.10) and 0.651 (95% CI: 0.480-0.822, P=0.10) for the diagnosis of fibrosis ≥ F2 and F3-F4, respectively. Cut-offs for CAP were 246.5 dB/m for S1 and 275.5 dB/m for S2. Cut-offs for LSM were 7.65 kPa for ≥ F2 and 9.25 kPa for ≥ F3.</p><p><strong>Conclusions: </strong>TE may be useful for screening advanced fibrosis and, interestingly, steatosis after LT. TE might gain relevance to track graft metabolic dysfunction and to propose lifestyle interventions.</p>","PeriodicalId":94362,"journal":{"name":"Translational gastroenterology and hepatology","volume":"10 ","pages":"51"},"PeriodicalIF":2.5000,"publicationDate":"2025-06-26","publicationTypes":"Journal Article","fieldsOfStudy":null,"isOpenAccess":false,"openAccessPdf":"https://www.ncbi.nlm.nih.gov/pmc/articles/PMC12314711/pdf/","citationCount":"0","resultStr":"{\"title\":\"Early diagnosis of liver graft steatosis and fibrosis: are non-invasive tests the answer?\",\"authors\":\"Colin Dumont, Samuele Iesari, Pamela Baldin, Selda Aydin, Guillaume Henin, Marie Philippart, Eliano Bonaccorsi-Riani, Olga Ciccarelli, Laurent Coubeau, Hubert Piessevaux, Nicolas Lanthier, Géraldine Dahlqvist\",\"doi\":\"10.21037/tgh-24-131\",\"DOIUrl\":null,\"url\":null,\"abstract\":\"<p><strong>Background: </strong>Graft steatosis and fibrosis detection is a challenge to avoid graft loss. The role of liver biopsy (LB) after liver transplantation (LT) is changing with the emergence of non-invasive tests. Our aim is to evaluate the accuracy of transient elastography (TE) in predicting steatosis and fibrosis post-LT.</p><p><strong>Methods: </strong>This prospective study was performed on 158 LT patients. Controlled attenuation parameter (CAP) and liver stiffness measurement (LSM) were carried out prior to LB. We built receiver operating characteristic (ROC) curves to evaluate the predictive performance of TE.</p><p><strong>Results: </strong>Using CAP, the area under the curve (AUC) were 0.872 [95% confidence interval (CI): 0.791-0.953, P=0.01] and 0.708 (95% CI: 0.614-0.801, P<0.001) for the diagnosis of steatosis ≥ S2 and ≥ S1, respectively. Using LSM, the AUC were 0.588 (95% CI: 0.486-0.691, P=0.10) and 0.651 (95% CI: 0.480-0.822, P=0.10) for the diagnosis of fibrosis ≥ F2 and F3-F4, respectively. Cut-offs for CAP were 246.5 dB/m for S1 and 275.5 dB/m for S2. Cut-offs for LSM were 7.65 kPa for ≥ F2 and 9.25 kPa for ≥ F3.</p><p><strong>Conclusions: </strong>TE may be useful for screening advanced fibrosis and, interestingly, steatosis after LT. TE might gain relevance to track graft metabolic dysfunction and to propose lifestyle interventions.</p>\",\"PeriodicalId\":94362,\"journal\":{\"name\":\"Translational gastroenterology and hepatology\",\"volume\":\"10 \",\"pages\":\"51\"},\"PeriodicalIF\":2.5000,\"publicationDate\":\"2025-06-26\",\"publicationTypes\":\"Journal Article\",\"fieldsOfStudy\":null,\"isOpenAccess\":false,\"openAccessPdf\":\"https://www.ncbi.nlm.nih.gov/pmc/articles/PMC12314711/pdf/\",\"citationCount\":\"0\",\"resultStr\":null,\"platform\":\"Semanticscholar\",\"paperid\":null,\"PeriodicalName\":\"Translational gastroenterology and hepatology\",\"FirstCategoryId\":\"1085\",\"ListUrlMain\":\"https://doi.org/10.21037/tgh-24-131\",\"RegionNum\":0,\"RegionCategory\":null,\"ArticlePicture\":[],\"TitleCN\":null,\"AbstractTextCN\":null,\"PMCID\":null,\"EPubDate\":\"2025/1/1 0:00:00\",\"PubModel\":\"eCollection\",\"JCR\":\"Q2\",\"JCRName\":\"GASTROENTEROLOGY & HEPATOLOGY\",\"Score\":null,\"Total\":0}","platform":"Semanticscholar","paperid":null,"PeriodicalName":"Translational gastroenterology and hepatology","FirstCategoryId":"1085","ListUrlMain":"https://doi.org/10.21037/tgh-24-131","RegionNum":0,"RegionCategory":null,"ArticlePicture":[],"TitleCN":null,"AbstractTextCN":null,"PMCID":null,"EPubDate":"2025/1/1 0:00:00","PubModel":"eCollection","JCR":"Q2","JCRName":"GASTROENTEROLOGY & HEPATOLOGY","Score":null,"Total":0}
Early diagnosis of liver graft steatosis and fibrosis: are non-invasive tests the answer?
Background: Graft steatosis and fibrosis detection is a challenge to avoid graft loss. The role of liver biopsy (LB) after liver transplantation (LT) is changing with the emergence of non-invasive tests. Our aim is to evaluate the accuracy of transient elastography (TE) in predicting steatosis and fibrosis post-LT.
Methods: This prospective study was performed on 158 LT patients. Controlled attenuation parameter (CAP) and liver stiffness measurement (LSM) were carried out prior to LB. We built receiver operating characteristic (ROC) curves to evaluate the predictive performance of TE.
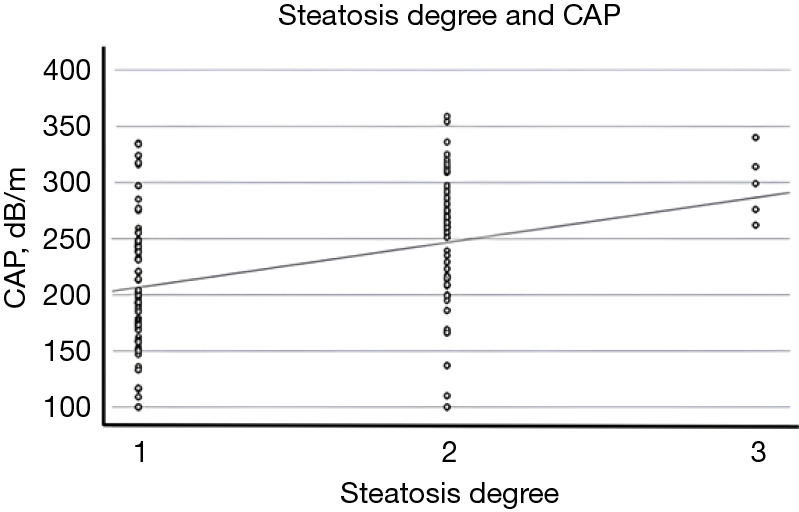
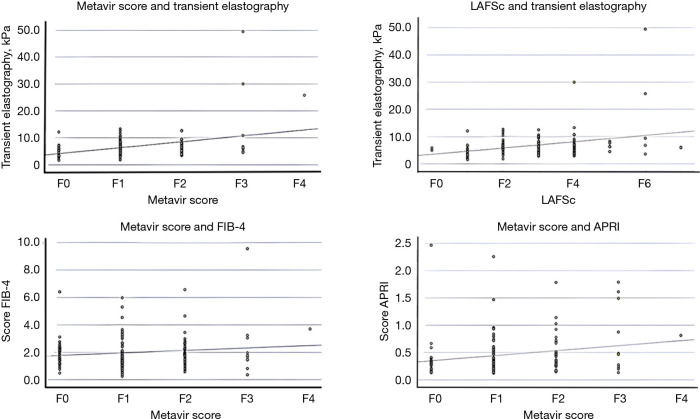
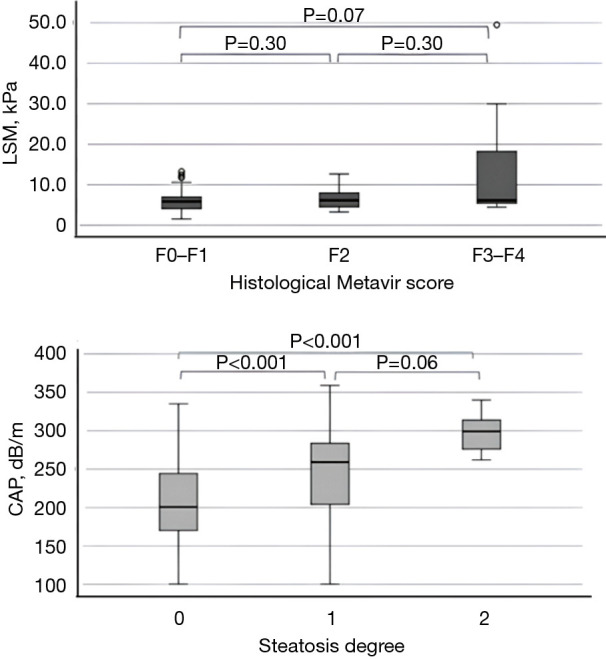
Results: Using CAP, the area under the curve (AUC) were 0.872 [95% confidence interval (CI): 0.791-0.953, P=0.01] and 0.708 (95% CI: 0.614-0.801, P<0.001) for the diagnosis of steatosis ≥ S2 and ≥ S1, respectively. Using LSM, the AUC were 0.588 (95% CI: 0.486-0.691, P=0.10) and 0.651 (95% CI: 0.480-0.822, P=0.10) for the diagnosis of fibrosis ≥ F2 and F3-F4, respectively. Cut-offs for CAP were 246.5 dB/m for S1 and 275.5 dB/m for S2. Cut-offs for LSM were 7.65 kPa for ≥ F2 and 9.25 kPa for ≥ F3.
Conclusions: TE may be useful for screening advanced fibrosis and, interestingly, steatosis after LT. TE might gain relevance to track graft metabolic dysfunction and to propose lifestyle interventions.

 求助内容:
求助内容: 应助结果提醒方式:


