{"title":"三种不同水致模糊模拟方法测量游标精度的比较。","authors":"Vivek Suganthan Ramasubramanian, Aiswaryah Radhakrishnan","doi":"10.18502/jovr.v20.13887","DOIUrl":null,"url":null,"abstract":"<p><strong>Purpose: </strong>Human vision is subnormal in an aquatic environment, and studies have used different methods to measure visual functions with water-induced blur (WIB). In this study, we compared vernier acuity measured using three different WIB simulation methods.</p><p><strong>Methods: </strong>Sixty young adults (20 in each group) with best-corrected visual acuity of <math><mo>≥</mo></math> 6/6 participated in the study. Three different methods, one for each study group, were used to simulate WIB in order to measure the vernier acuity. The methods comprised M1: a glass tank filled with water containing a wave motor to produce waves, M2: a sprinkler with uncontrolled water splash against the glass, and M3: a sprinkler with controlled water splash against the glass. For each of the three methods, vernier acuity was measured binocularly (three trials of 50 presentations each) both at baseline (without simulated WIB) in the absence of WIB and under simulated WIB. This was conducted using FrACT presented on the Display++ monitor at a distance of 2 meters from the participant. The vernier target consisted of two vertical lines (1 x 15 arcmin) with a vertical separation of 0.5 arcmin.</p><p><strong>Results: </strong>The mean baseline vernier acuity (arcsec) was found to be similar (F<sup>[2, 57]</sup> = 0.20, <i>P</i> = 0.82) among all three groups (M1: 13.28 <math><mo>±</mo></math> 5.84, M2: 14.44 <math><mo>±</mo></math> 6.34, M3: 14.05 <math><mo>±</mo></math> 3.28). Vernier acuity with simulated WIB was least degraded with M1 (19.84 <math><mo>±</mo></math> 8.40) and more degraded with M2 (288.74 <math><mo>±</mo></math> 56.61), followed by M3 (49.14 <math><mo>±</mo></math> 20.13). One-way ANOVA revealed a significant difference among the three methods (F [2, 57] = 354.72, <i>P</i> <math><mo><</mo></math> 0.001).</p><p><strong>Conclusion: </strong>Our results suggest that the impact of simulated WIB on vernier acuity is not comparable due to differences in the strength of blur and the varied spatial and temporal properties of different simulated WIB methods. This emphasizes the need to develop a blur metric specific to WIB to objectively quantify its effect on different visual functions.</p>","PeriodicalId":16586,"journal":{"name":"Journal of Ophthalmic & Vision Research","volume":"20 ","pages":""},"PeriodicalIF":1.5000,"publicationDate":"2025-07-21","publicationTypes":"Journal Article","fieldsOfStudy":null,"isOpenAccess":false,"openAccessPdf":"https://www.ncbi.nlm.nih.gov/pmc/articles/PMC12284606/pdf/","citationCount":"0","resultStr":"{\"title\":\"Comparison of Vernier Acuity Measured with Three Different Water-induced Blur Simulation Methods.\",\"authors\":\"Vivek Suganthan Ramasubramanian, Aiswaryah Radhakrishnan\",\"doi\":\"10.18502/jovr.v20.13887\",\"DOIUrl\":null,\"url\":null,\"abstract\":\"<p><strong>Purpose: </strong>Human vision is subnormal in an aquatic environment, and studies have used different methods to measure visual functions with water-induced blur (WIB). In this study, we compared vernier acuity measured using three different WIB simulation methods.</p><p><strong>Methods: </strong>Sixty young adults (20 in each group) with best-corrected visual acuity of <math><mo>≥</mo></math> 6/6 participated in the study. Three different methods, one for each study group, were used to simulate WIB in order to measure the vernier acuity. The methods comprised M1: a glass tank filled with water containing a wave motor to produce waves, M2: a sprinkler with uncontrolled water splash against the glass, and M3: a sprinkler with controlled water splash against the glass. For each of the three methods, vernier acuity was measured binocularly (three trials of 50 presentations each) both at baseline (without simulated WIB) in the absence of WIB and under simulated WIB. This was conducted using FrACT presented on the Display++ monitor at a distance of 2 meters from the participant. The vernier target consisted of two vertical lines (1 x 15 arcmin) with a vertical separation of 0.5 arcmin.</p><p><strong>Results: </strong>The mean baseline vernier acuity (arcsec) was found to be similar (F<sup>[2, 57]</sup> = 0.20, <i>P</i> = 0.82) among all three groups (M1: 13.28 <math><mo>±</mo></math> 5.84, M2: 14.44 <math><mo>±</mo></math> 6.34, M3: 14.05 <math><mo>±</mo></math> 3.28). Vernier acuity with simulated WIB was least degraded with M1 (19.84 <math><mo>±</mo></math> 8.40) and more degraded with M2 (288.74 <math><mo>±</mo></math> 56.61), followed by M3 (49.14 <math><mo>±</mo></math> 20.13). One-way ANOVA revealed a significant difference among the three methods (F [2, 57] = 354.72, <i>P</i> <math><mo><</mo></math> 0.001).</p><p><strong>Conclusion: </strong>Our results suggest that the impact of simulated WIB on vernier acuity is not comparable due to differences in the strength of blur and the varied spatial and temporal properties of different simulated WIB methods. This emphasizes the need to develop a blur metric specific to WIB to objectively quantify its effect on different visual functions.</p>\",\"PeriodicalId\":16586,\"journal\":{\"name\":\"Journal of Ophthalmic & Vision Research\",\"volume\":\"20 \",\"pages\":\"\"},\"PeriodicalIF\":1.5000,\"publicationDate\":\"2025-07-21\",\"publicationTypes\":\"Journal Article\",\"fieldsOfStudy\":null,\"isOpenAccess\":false,\"openAccessPdf\":\"https://www.ncbi.nlm.nih.gov/pmc/articles/PMC12284606/pdf/\",\"citationCount\":\"0\",\"resultStr\":null,\"platform\":\"Semanticscholar\",\"paperid\":null,\"PeriodicalName\":\"Journal of Ophthalmic & Vision Research\",\"FirstCategoryId\":\"1085\",\"ListUrlMain\":\"https://doi.org/10.18502/jovr.v20.13887\",\"RegionNum\":0,\"RegionCategory\":null,\"ArticlePicture\":[],\"TitleCN\":null,\"AbstractTextCN\":null,\"PMCID\":null,\"EPubDate\":\"2025/1/1 0:00:00\",\"PubModel\":\"eCollection\",\"JCR\":\"Q3\",\"JCRName\":\"OPHTHALMOLOGY\",\"Score\":null,\"Total\":0}","platform":"Semanticscholar","paperid":null,"PeriodicalName":"Journal of Ophthalmic & Vision Research","FirstCategoryId":"1085","ListUrlMain":"https://doi.org/10.18502/jovr.v20.13887","RegionNum":0,"RegionCategory":null,"ArticlePicture":[],"TitleCN":null,"AbstractTextCN":null,"PMCID":null,"EPubDate":"2025/1/1 0:00:00","PubModel":"eCollection","JCR":"Q3","JCRName":"OPHTHALMOLOGY","Score":null,"Total":0}
引用次数: 0
摘要
目的:人类的视觉在水环境中是亚正常的,研究使用了不同的方法来测量水致模糊(WIB)的视觉功能。在本研究中,我们比较了使用三种不同的WIB模拟方法测量的游标敏锐度。方法:60例最佳矫正视力≥6/6的青壮年,每组20例。三个不同的方法,每个研究组一个,被用来模拟WIB,以测量游标的敏锐度。这些方法包括M1:一个装满水的玻璃罐,里面有一个波浪电机来产生波浪,M2:一个不受控制的水溅向玻璃的洒水器,M3:一个控制水溅向玻璃的洒水器。对于三种方法中的每一种,在基线(没有模拟WIB)和模拟WIB下,用双眼测量游标敏锐度(每次50次试验)。这是在距离参与者2米的地方使用display++监视器上显示的FrACT进行的。游标目标由两条垂直线(1 x 15角分)组成,垂直间距为0.5角分。结果:三组患者平均基线游标视力(arcsec)相近(F[2,57] = 0.20, P = 0.82) (M1: 13.28±5.84,M2: 14.44±6.34,M3: 14.05±3.28)。模拟WIB的光标清晰度M1(19.84±8.40)降低最少,M2(288.74±56.61)降低最多,M3(49.14±20.13)次之。单因素方差分析显示三种方法之间存在显著差异(F [2,57] = 354.72, P 0.001)。结论:由于不同模拟WIB方法的模糊强度和时空特性的差异,模拟WIB对游标清晰度的影响具有可比性。这强调需要开发一个特定于WIB的模糊度量,以客观地量化其对不同视觉功能的影响。
Comparison of Vernier Acuity Measured with Three Different Water-induced Blur Simulation Methods.
Purpose: Human vision is subnormal in an aquatic environment, and studies have used different methods to measure visual functions with water-induced blur (WIB). In this study, we compared vernier acuity measured using three different WIB simulation methods.
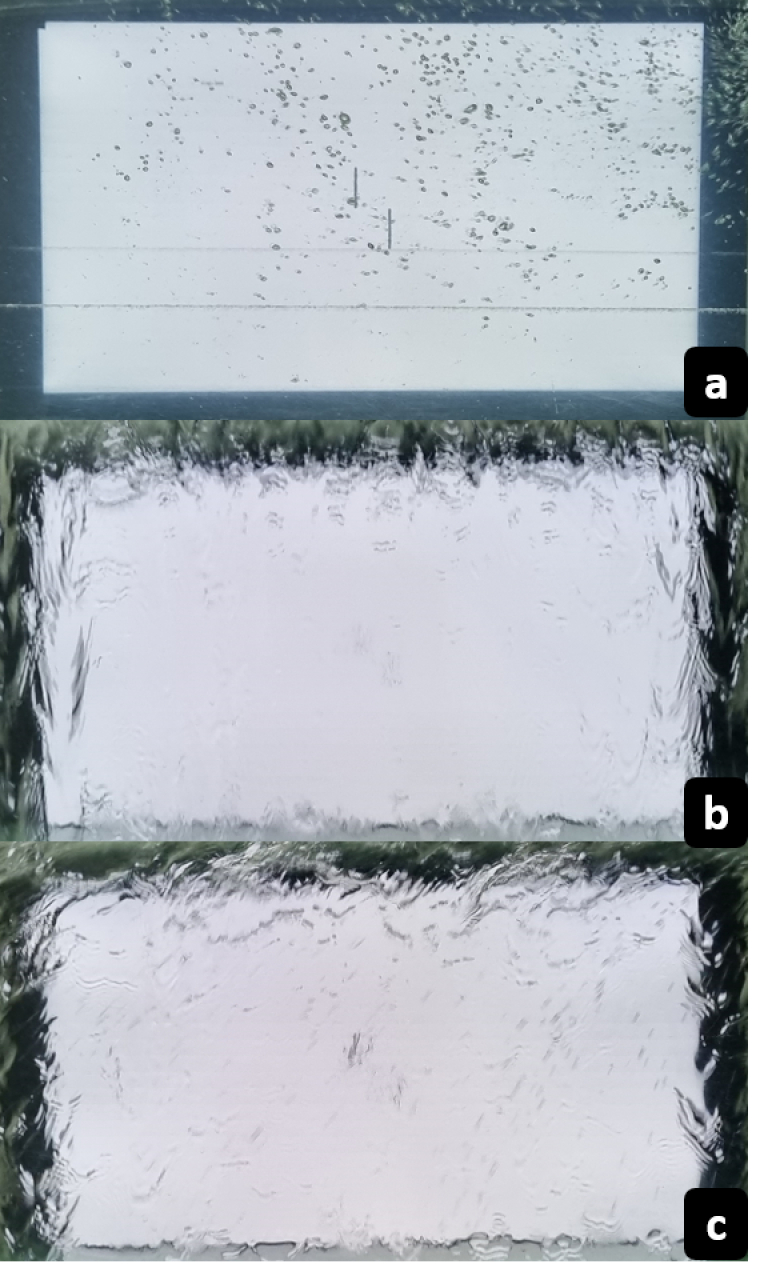
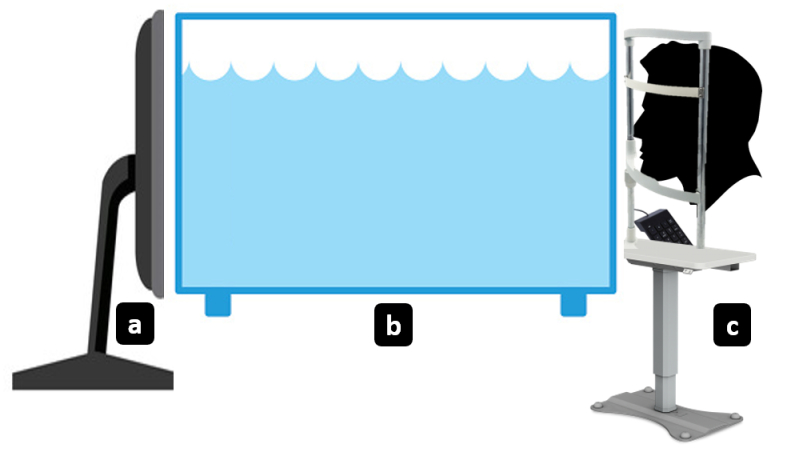
Methods: Sixty young adults (20 in each group) with best-corrected visual acuity of 6/6 participated in the study. Three different methods, one for each study group, were used to simulate WIB in order to measure the vernier acuity. The methods comprised M1: a glass tank filled with water containing a wave motor to produce waves, M2: a sprinkler with uncontrolled water splash against the glass, and M3: a sprinkler with controlled water splash against the glass. For each of the three methods, vernier acuity was measured binocularly (three trials of 50 presentations each) both at baseline (without simulated WIB) in the absence of WIB and under simulated WIB. This was conducted using FrACT presented on the Display++ monitor at a distance of 2 meters from the participant. The vernier target consisted of two vertical lines (1 x 15 arcmin) with a vertical separation of 0.5 arcmin.
Results: The mean baseline vernier acuity (arcsec) was found to be similar (F[2, 57] = 0.20, P = 0.82) among all three groups (M1: 13.28 5.84, M2: 14.44 6.34, M3: 14.05 3.28). Vernier acuity with simulated WIB was least degraded with M1 (19.84 8.40) and more degraded with M2 (288.74 56.61), followed by M3 (49.14 20.13). One-way ANOVA revealed a significant difference among the three methods (F [2, 57] = 354.72, P 0.001).
Conclusion: Our results suggest that the impact of simulated WIB on vernier acuity is not comparable due to differences in the strength of blur and the varied spatial and temporal properties of different simulated WIB methods. This emphasizes the need to develop a blur metric specific to WIB to objectively quantify its effect on different visual functions.

 求助内容:
求助内容: 应助结果提醒方式:


