Alex J Hoogerbrugge, Ignace T C Hooge, Roy S Hessels, Christoph Strauch
{"title":"什么时候才算够?确定现场观看研究参与者样本量的经验指南。","authors":"Alex J Hoogerbrugge, Ignace T C Hooge, Roy S Hessels, Christoph Strauch","doi":"10.3758/s13428-025-02754-8","DOIUrl":null,"url":null,"abstract":"<p><p>Eye tracking is widely used to study where spatial attention is allocated across stimuli. However, determining a sufficient and efficient number of participants for such studies remains a challenge. While clear guidelines have been established for many classical statistical tests, no straightforward participant sample size guidelines exist for the comparison of gaze distribution maps and area-of-interest analyses - two of the most prominent analyses in scene viewing studies. Just how many participants should be included for reliable and reproducible gaze estimations? We here utilized gaze data to a single static image, viewed by 1248 individuals (dataset 1), and gaze data to 200+ images, viewed by 84 participants each (dataset 2). Researchers can assess which of these datasets and analysis types most resemble their setup and determine their sample size accordingly. Although we cannot provide a one-size-fits-all sample size recommendation, we show progressively diminishing returns for a range of sample sizes and for two typical study types. For example, when using Normalized Saliency Score as a metric of distribution map similarity, a 5% relative increase requires increases in sample size from 13 <math><mo>→</mo></math> 20 <math><mo>→</mo></math> 34 participants (based on dataset 1) or from 10 <math><mo>→</mo></math> 16 <math><mo>→</mo></math> 32 participants (based on dataset 2). Alternatively, when analyzing the number of visits to certain areas of interest, a 25% decrease in outcome variance requires increases in sample size from 13 <math><mo>→</mo></math> 24 <math><mo>→</mo></math> 44. We provide easy-to-use guidelines and reference tables to determine scene viewing participant sample size for academics and industry professionals alike.</p>","PeriodicalId":8717,"journal":{"name":"Behavior Research Methods","volume":"57 9","pages":"241"},"PeriodicalIF":3.9000,"publicationDate":"2025-07-28","publicationTypes":"Journal Article","fieldsOfStudy":null,"isOpenAccess":false,"openAccessPdf":"https://www.ncbi.nlm.nih.gov/pmc/articles/PMC12304073/pdf/","citationCount":"0","resultStr":"{\"title\":\"When is enough enough? Empirical guidelines to determine participant sample size for scene viewing studies.\",\"authors\":\"Alex J Hoogerbrugge, Ignace T C Hooge, Roy S Hessels, Christoph Strauch\",\"doi\":\"10.3758/s13428-025-02754-8\",\"DOIUrl\":null,\"url\":null,\"abstract\":\"<p><p>Eye tracking is widely used to study where spatial attention is allocated across stimuli. However, determining a sufficient and efficient number of participants for such studies remains a challenge. While clear guidelines have been established for many classical statistical tests, no straightforward participant sample size guidelines exist for the comparison of gaze distribution maps and area-of-interest analyses - two of the most prominent analyses in scene viewing studies. Just how many participants should be included for reliable and reproducible gaze estimations? We here utilized gaze data to a single static image, viewed by 1248 individuals (dataset 1), and gaze data to 200+ images, viewed by 84 participants each (dataset 2). Researchers can assess which of these datasets and analysis types most resemble their setup and determine their sample size accordingly. Although we cannot provide a one-size-fits-all sample size recommendation, we show progressively diminishing returns for a range of sample sizes and for two typical study types. For example, when using Normalized Saliency Score as a metric of distribution map similarity, a 5% relative increase requires increases in sample size from 13 <math><mo>→</mo></math> 20 <math><mo>→</mo></math> 34 participants (based on dataset 1) or from 10 <math><mo>→</mo></math> 16 <math><mo>→</mo></math> 32 participants (based on dataset 2). Alternatively, when analyzing the number of visits to certain areas of interest, a 25% decrease in outcome variance requires increases in sample size from 13 <math><mo>→</mo></math> 24 <math><mo>→</mo></math> 44. We provide easy-to-use guidelines and reference tables to determine scene viewing participant sample size for academics and industry professionals alike.</p>\",\"PeriodicalId\":8717,\"journal\":{\"name\":\"Behavior Research Methods\",\"volume\":\"57 9\",\"pages\":\"241\"},\"PeriodicalIF\":3.9000,\"publicationDate\":\"2025-07-28\",\"publicationTypes\":\"Journal Article\",\"fieldsOfStudy\":null,\"isOpenAccess\":false,\"openAccessPdf\":\"https://www.ncbi.nlm.nih.gov/pmc/articles/PMC12304073/pdf/\",\"citationCount\":\"0\",\"resultStr\":null,\"platform\":\"Semanticscholar\",\"paperid\":null,\"PeriodicalName\":\"Behavior Research Methods\",\"FirstCategoryId\":\"102\",\"ListUrlMain\":\"https://doi.org/10.3758/s13428-025-02754-8\",\"RegionNum\":2,\"RegionCategory\":\"心理学\",\"ArticlePicture\":[],\"TitleCN\":null,\"AbstractTextCN\":null,\"PMCID\":null,\"EPubDate\":\"\",\"PubModel\":\"\",\"JCR\":\"Q1\",\"JCRName\":\"PSYCHOLOGY, EXPERIMENTAL\",\"Score\":null,\"Total\":0}","platform":"Semanticscholar","paperid":null,"PeriodicalName":"Behavior Research Methods","FirstCategoryId":"102","ListUrlMain":"https://doi.org/10.3758/s13428-025-02754-8","RegionNum":2,"RegionCategory":"心理学","ArticlePicture":[],"TitleCN":null,"AbstractTextCN":null,"PMCID":null,"EPubDate":"","PubModel":"","JCR":"Q1","JCRName":"PSYCHOLOGY, EXPERIMENTAL","Score":null,"Total":0}
When is enough enough? Empirical guidelines to determine participant sample size for scene viewing studies.
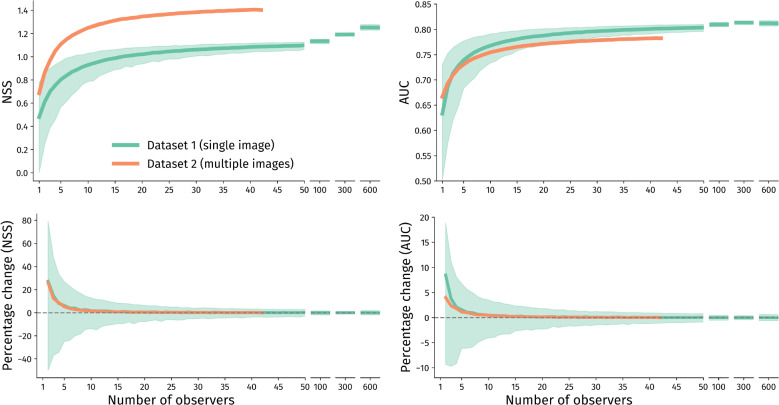
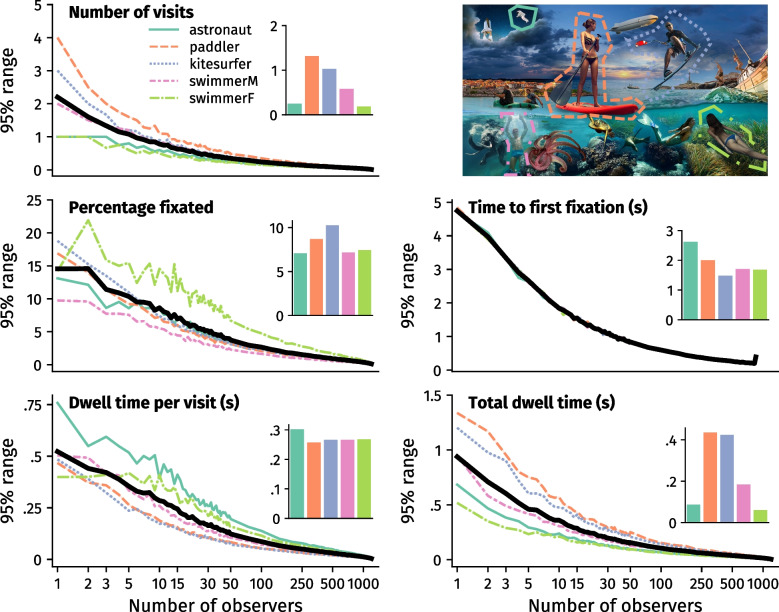
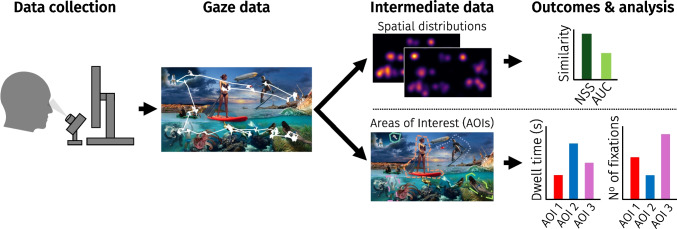
Eye tracking is widely used to study where spatial attention is allocated across stimuli. However, determining a sufficient and efficient number of participants for such studies remains a challenge. While clear guidelines have been established for many classical statistical tests, no straightforward participant sample size guidelines exist for the comparison of gaze distribution maps and area-of-interest analyses - two of the most prominent analyses in scene viewing studies. Just how many participants should be included for reliable and reproducible gaze estimations? We here utilized gaze data to a single static image, viewed by 1248 individuals (dataset 1), and gaze data to 200+ images, viewed by 84 participants each (dataset 2). Researchers can assess which of these datasets and analysis types most resemble their setup and determine their sample size accordingly. Although we cannot provide a one-size-fits-all sample size recommendation, we show progressively diminishing returns for a range of sample sizes and for two typical study types. For example, when using Normalized Saliency Score as a metric of distribution map similarity, a 5% relative increase requires increases in sample size from 13 20 34 participants (based on dataset 1) or from 10 16 32 participants (based on dataset 2). Alternatively, when analyzing the number of visits to certain areas of interest, a 25% decrease in outcome variance requires increases in sample size from 13 24 44. We provide easy-to-use guidelines and reference tables to determine scene viewing participant sample size for academics and industry professionals alike.
期刊介绍:
Behavior Research Methods publishes articles concerned with the methods, techniques, and instrumentation of research in experimental psychology. The journal focuses particularly on the use of computer technology in psychological research. An annual special issue is devoted to this field.
 求助内容:
求助内容: 应助结果提醒方式:


