Sophie G Zaloumis, Megha Rajasekhar, Julie A Simpson
{"title":"如何使用学习曲线来评估使用机器学习算法开发的疟疾预测模型的样本量。","authors":"Sophie G Zaloumis, Megha Rajasekhar, Julie A Simpson","doi":"10.1186/s12936-025-05479-3","DOIUrl":null,"url":null,"abstract":"<p><strong>Background: </strong>Machine learning algorithms have been used to predict malaria risk and severity, identify immunity biomarkers for malaria vaccine candidates, and determine molecular biomarkers of antimalarial drug resistance. Developing these prediction models requires large training datasets to ensure prediction accuracy when applied to new individuals in the target population. Learning curves can be used to assess the sample size required for the training dataset by evaluating the predictive performance of a model trained using different dataset sizes. These curves are agnostic to the specific prediction model, but their construction does require existing data. This tutorial demonstrates how to generate and interpret learning curves for malaria prediction models developed using machine learning algorithms.</p><p><strong>Methods: </strong>To illustrate the approach, training dataset sizes were evaluated to inform the design of a \"mock\" prediction modelling study aimed to predict the artemisinin resistance status of Plasmodium falciparum malaria isolates from gene expression data. Data were simulated based on a previously published in vivo parasite gene expression dataset, which contained transcriptomes of 1043 P. falciparum isolates from patients with acute malaria, of which 29% (299/1043) were from slow clearing infections (parasite clearance half-life > 5 h). Learning curves were produced for two machine learning algorithms, sparse Partial Least Squares-Discriminant Analysis plus Support Vector Machines (sPLSDA + SVMs) and random forests. Prediction error was measured using the balanced error rate (average of percentage of slow clearing infections incorrectly predicted as fast and percentage of fast clearing infections predicted as slow).</p><p><strong>Results: </strong>For this mock malaria prediction study, the balanced error rate on a test dataset not used for model training (208 samples) was 50% for sPLSDA + SVMs and 50% for random forests on the smallest training dataset evaluated (20 samples) and 14% for sPLSDA + SVMs and 22% for random forests on the largest training dataset evaluated (835 samples). The shape of the learning curves indicates that increasing the training dataset size beyond 835 samples is unlikely to significantly reduce the balanced error rates further.</p><p><strong>Conclusions: </strong>Learning curves are a simple tool that can be used to determine the minimum sample size required for future prediction modelling studies of different malaria outcomes that use machine learning algorithms for prediction. These curves need to be generated for each specific prediction modelling application.</p>","PeriodicalId":18317,"journal":{"name":"Malaria Journal","volume":"24 1","pages":"242"},"PeriodicalIF":3.0000,"publicationDate":"2025-07-24","publicationTypes":"Journal Article","fieldsOfStudy":null,"isOpenAccess":false,"openAccessPdf":"https://www.ncbi.nlm.nih.gov/pmc/articles/PMC12291394/pdf/","citationCount":"0","resultStr":"{\"title\":\"How to use learning curves to evaluate the sample size for malaria prediction models developed using machine learning algorithms.\",\"authors\":\"Sophie G Zaloumis, Megha Rajasekhar, Julie A Simpson\",\"doi\":\"10.1186/s12936-025-05479-3\",\"DOIUrl\":null,\"url\":null,\"abstract\":\"<p><strong>Background: </strong>Machine learning algorithms have been used to predict malaria risk and severity, identify immunity biomarkers for malaria vaccine candidates, and determine molecular biomarkers of antimalarial drug resistance. Developing these prediction models requires large training datasets to ensure prediction accuracy when applied to new individuals in the target population. Learning curves can be used to assess the sample size required for the training dataset by evaluating the predictive performance of a model trained using different dataset sizes. These curves are agnostic to the specific prediction model, but their construction does require existing data. This tutorial demonstrates how to generate and interpret learning curves for malaria prediction models developed using machine learning algorithms.</p><p><strong>Methods: </strong>To illustrate the approach, training dataset sizes were evaluated to inform the design of a \\\"mock\\\" prediction modelling study aimed to predict the artemisinin resistance status of Plasmodium falciparum malaria isolates from gene expression data. Data were simulated based on a previously published in vivo parasite gene expression dataset, which contained transcriptomes of 1043 P. falciparum isolates from patients with acute malaria, of which 29% (299/1043) were from slow clearing infections (parasite clearance half-life > 5 h). Learning curves were produced for two machine learning algorithms, sparse Partial Least Squares-Discriminant Analysis plus Support Vector Machines (sPLSDA + SVMs) and random forests. Prediction error was measured using the balanced error rate (average of percentage of slow clearing infections incorrectly predicted as fast and percentage of fast clearing infections predicted as slow).</p><p><strong>Results: </strong>For this mock malaria prediction study, the balanced error rate on a test dataset not used for model training (208 samples) was 50% for sPLSDA + SVMs and 50% for random forests on the smallest training dataset evaluated (20 samples) and 14% for sPLSDA + SVMs and 22% for random forests on the largest training dataset evaluated (835 samples). The shape of the learning curves indicates that increasing the training dataset size beyond 835 samples is unlikely to significantly reduce the balanced error rates further.</p><p><strong>Conclusions: </strong>Learning curves are a simple tool that can be used to determine the minimum sample size required for future prediction modelling studies of different malaria outcomes that use machine learning algorithms for prediction. These curves need to be generated for each specific prediction modelling application.</p>\",\"PeriodicalId\":18317,\"journal\":{\"name\":\"Malaria Journal\",\"volume\":\"24 1\",\"pages\":\"242\"},\"PeriodicalIF\":3.0000,\"publicationDate\":\"2025-07-24\",\"publicationTypes\":\"Journal Article\",\"fieldsOfStudy\":null,\"isOpenAccess\":false,\"openAccessPdf\":\"https://www.ncbi.nlm.nih.gov/pmc/articles/PMC12291394/pdf/\",\"citationCount\":\"0\",\"resultStr\":null,\"platform\":\"Semanticscholar\",\"paperid\":null,\"PeriodicalName\":\"Malaria Journal\",\"FirstCategoryId\":\"3\",\"ListUrlMain\":\"https://doi.org/10.1186/s12936-025-05479-3\",\"RegionNum\":3,\"RegionCategory\":\"医学\",\"ArticlePicture\":[],\"TitleCN\":null,\"AbstractTextCN\":null,\"PMCID\":null,\"EPubDate\":\"\",\"PubModel\":\"\",\"JCR\":\"Q3\",\"JCRName\":\"INFECTIOUS DISEASES\",\"Score\":null,\"Total\":0}","platform":"Semanticscholar","paperid":null,"PeriodicalName":"Malaria Journal","FirstCategoryId":"3","ListUrlMain":"https://doi.org/10.1186/s12936-025-05479-3","RegionNum":3,"RegionCategory":"医学","ArticlePicture":[],"TitleCN":null,"AbstractTextCN":null,"PMCID":null,"EPubDate":"","PubModel":"","JCR":"Q3","JCRName":"INFECTIOUS DISEASES","Score":null,"Total":0}
How to use learning curves to evaluate the sample size for malaria prediction models developed using machine learning algorithms.
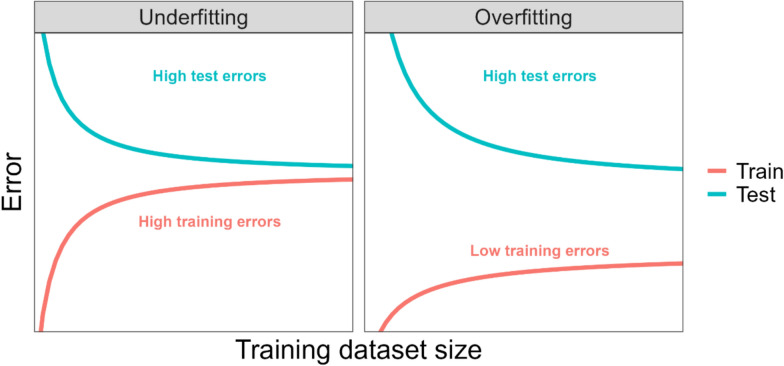
Background: Machine learning algorithms have been used to predict malaria risk and severity, identify immunity biomarkers for malaria vaccine candidates, and determine molecular biomarkers of antimalarial drug resistance. Developing these prediction models requires large training datasets to ensure prediction accuracy when applied to new individuals in the target population. Learning curves can be used to assess the sample size required for the training dataset by evaluating the predictive performance of a model trained using different dataset sizes. These curves are agnostic to the specific prediction model, but their construction does require existing data. This tutorial demonstrates how to generate and interpret learning curves for malaria prediction models developed using machine learning algorithms.
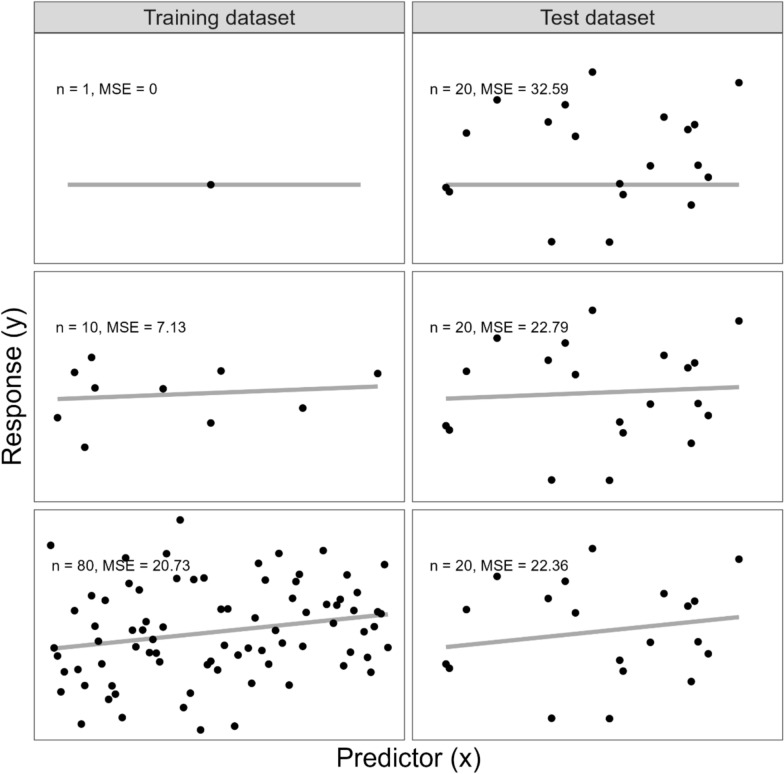
Methods: To illustrate the approach, training dataset sizes were evaluated to inform the design of a "mock" prediction modelling study aimed to predict the artemisinin resistance status of Plasmodium falciparum malaria isolates from gene expression data. Data were simulated based on a previously published in vivo parasite gene expression dataset, which contained transcriptomes of 1043 P. falciparum isolates from patients with acute malaria, of which 29% (299/1043) were from slow clearing infections (parasite clearance half-life > 5 h). Learning curves were produced for two machine learning algorithms, sparse Partial Least Squares-Discriminant Analysis plus Support Vector Machines (sPLSDA + SVMs) and random forests. Prediction error was measured using the balanced error rate (average of percentage of slow clearing infections incorrectly predicted as fast and percentage of fast clearing infections predicted as slow).
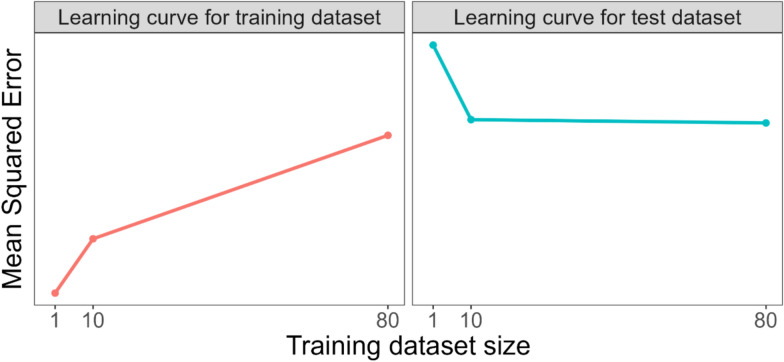
Results: For this mock malaria prediction study, the balanced error rate on a test dataset not used for model training (208 samples) was 50% for sPLSDA + SVMs and 50% for random forests on the smallest training dataset evaluated (20 samples) and 14% for sPLSDA + SVMs and 22% for random forests on the largest training dataset evaluated (835 samples). The shape of the learning curves indicates that increasing the training dataset size beyond 835 samples is unlikely to significantly reduce the balanced error rates further.
Conclusions: Learning curves are a simple tool that can be used to determine the minimum sample size required for future prediction modelling studies of different malaria outcomes that use machine learning algorithms for prediction. These curves need to be generated for each specific prediction modelling application.
期刊介绍:
Malaria Journal is aimed at the scientific community interested in malaria in its broadest sense. It is the only journal that publishes exclusively articles on malaria and, as such, it aims to bring together knowledge from the different specialities involved in this very broad discipline, from the bench to the bedside and to the field.

 求助内容:
求助内容: 应助结果提醒方式:


