Leon L Csonka, Antti Tikkakoski, Liisa Vuotari, Jussi Karjalainen, Lauri Lehtimäki
{"title":"沙丁胺醇致支气管扩张后乙酰胆碱激发试验PEF和FEV1变化的关系。","authors":"Leon L Csonka, Antti Tikkakoski, Liisa Vuotari, Jussi Karjalainen, Lauri Lehtimäki","doi":"10.1155/pm/7675935","DOIUrl":null,"url":null,"abstract":"<p><p>Asthma diagnosis can be confirmed by observing significant bronchodilator response (BDR) through peak expiratory flow (PEF) at home or forced expiratory volume in 1 s (FEV<sub>1</sub>) via spirometry in a clinical setting. We aimed to use the administration of salbutamol after a methacholine challenge test as a model of bronchodilation to study how accurately the change in PEF predicts improvement in lung function, as defined by an increase in FEV<sub>1</sub>. We analyzed 869 adult patients who were administered salbutamol after a methacholine challenge. To compare relative changes in PEF and FEV<sub>1</sub> during bronchodilation, we used regression analysis and constructed a Bland and Altman plot. ROC analysis, sensitivity, specificity, positive and negative predictive values, and kappa coefficient assessed how precisely increases in PEF detected a 12% and 0.2-L improvement in FEV<sub>1</sub>. The average relative increase in FEV<sub>1</sub> was significantly greater than that in PEF. The area under the curve in the ROC analysis was 0.844 for PEF change to detect a 12% and 0.2-L increase in FEV<sub>1</sub>. The kappa values for changes in PEF and FEV<sub>1</sub> ranged from fair to moderate. BDR detected by the recommended 15% and 60 L/min cut-off for PEF identified less than half of true positives, while a 10% cut-off correctly identified close to 75% of them. PEF increase is not a reliable measure of BDR in comparison to FEV<sub>1</sub> increase, and a 10% improvement in PEF was the least inaccurate cut-off. Substituting the PEF meter with a handheld spirometer should be further investigated for asthma home monitoring.</p>","PeriodicalId":46434,"journal":{"name":"Pulmonary Medicine","volume":"2025 ","pages":"7675935"},"PeriodicalIF":2.1000,"publicationDate":"2025-07-07","publicationTypes":"Journal Article","fieldsOfStudy":null,"isOpenAccess":false,"openAccessPdf":"https://www.ncbi.nlm.nih.gov/pmc/articles/PMC12259322/pdf/","citationCount":"0","resultStr":"{\"title\":\"Relation of Changes in PEF and FEV<sub>1</sub> During Salbutamol-Induced Bronchodilation After Methacholine Challenge Test.\",\"authors\":\"Leon L Csonka, Antti Tikkakoski, Liisa Vuotari, Jussi Karjalainen, Lauri Lehtimäki\",\"doi\":\"10.1155/pm/7675935\",\"DOIUrl\":null,\"url\":null,\"abstract\":\"<p><p>Asthma diagnosis can be confirmed by observing significant bronchodilator response (BDR) through peak expiratory flow (PEF) at home or forced expiratory volume in 1 s (FEV<sub>1</sub>) via spirometry in a clinical setting. We aimed to use the administration of salbutamol after a methacholine challenge test as a model of bronchodilation to study how accurately the change in PEF predicts improvement in lung function, as defined by an increase in FEV<sub>1</sub>. We analyzed 869 adult patients who were administered salbutamol after a methacholine challenge. To compare relative changes in PEF and FEV<sub>1</sub> during bronchodilation, we used regression analysis and constructed a Bland and Altman plot. ROC analysis, sensitivity, specificity, positive and negative predictive values, and kappa coefficient assessed how precisely increases in PEF detected a 12% and 0.2-L improvement in FEV<sub>1</sub>. The average relative increase in FEV<sub>1</sub> was significantly greater than that in PEF. The area under the curve in the ROC analysis was 0.844 for PEF change to detect a 12% and 0.2-L increase in FEV<sub>1</sub>. The kappa values for changes in PEF and FEV<sub>1</sub> ranged from fair to moderate. BDR detected by the recommended 15% and 60 L/min cut-off for PEF identified less than half of true positives, while a 10% cut-off correctly identified close to 75% of them. PEF increase is not a reliable measure of BDR in comparison to FEV<sub>1</sub> increase, and a 10% improvement in PEF was the least inaccurate cut-off. Substituting the PEF meter with a handheld spirometer should be further investigated for asthma home monitoring.</p>\",\"PeriodicalId\":46434,\"journal\":{\"name\":\"Pulmonary Medicine\",\"volume\":\"2025 \",\"pages\":\"7675935\"},\"PeriodicalIF\":2.1000,\"publicationDate\":\"2025-07-07\",\"publicationTypes\":\"Journal Article\",\"fieldsOfStudy\":null,\"isOpenAccess\":false,\"openAccessPdf\":\"https://www.ncbi.nlm.nih.gov/pmc/articles/PMC12259322/pdf/\",\"citationCount\":\"0\",\"resultStr\":null,\"platform\":\"Semanticscholar\",\"paperid\":null,\"PeriodicalName\":\"Pulmonary Medicine\",\"FirstCategoryId\":\"1085\",\"ListUrlMain\":\"https://doi.org/10.1155/pm/7675935\",\"RegionNum\":0,\"RegionCategory\":null,\"ArticlePicture\":[],\"TitleCN\":null,\"AbstractTextCN\":null,\"PMCID\":null,\"EPubDate\":\"2025/1/1 0:00:00\",\"PubModel\":\"eCollection\",\"JCR\":\"Q3\",\"JCRName\":\"RESPIRATORY SYSTEM\",\"Score\":null,\"Total\":0}","platform":"Semanticscholar","paperid":null,"PeriodicalName":"Pulmonary Medicine","FirstCategoryId":"1085","ListUrlMain":"https://doi.org/10.1155/pm/7675935","RegionNum":0,"RegionCategory":null,"ArticlePicture":[],"TitleCN":null,"AbstractTextCN":null,"PMCID":null,"EPubDate":"2025/1/1 0:00:00","PubModel":"eCollection","JCR":"Q3","JCRName":"RESPIRATORY SYSTEM","Score":null,"Total":0}
Relation of Changes in PEF and FEV1 During Salbutamol-Induced Bronchodilation After Methacholine Challenge Test.
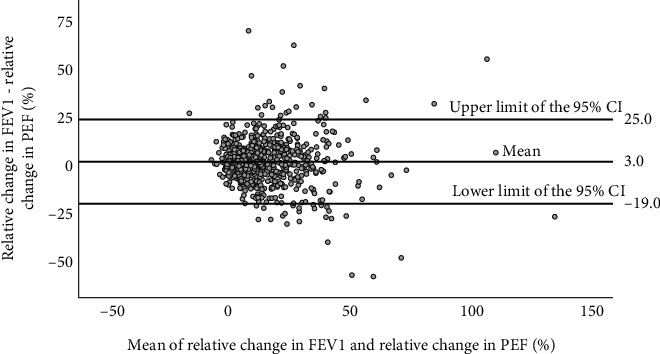
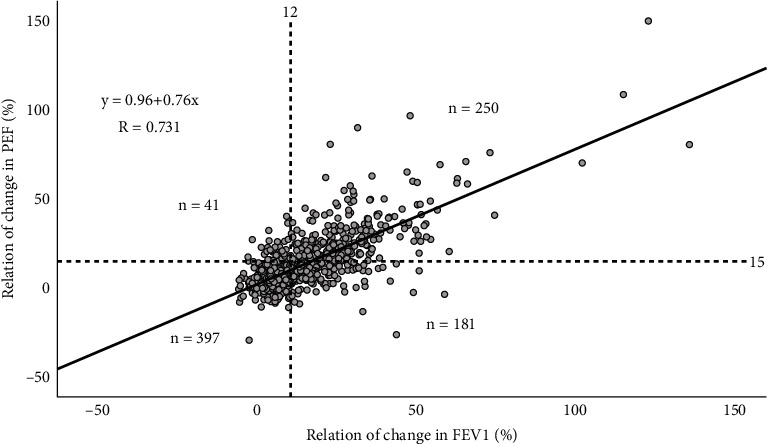
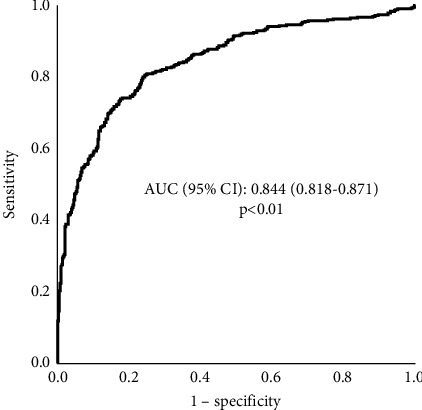
Asthma diagnosis can be confirmed by observing significant bronchodilator response (BDR) through peak expiratory flow (PEF) at home or forced expiratory volume in 1 s (FEV1) via spirometry in a clinical setting. We aimed to use the administration of salbutamol after a methacholine challenge test as a model of bronchodilation to study how accurately the change in PEF predicts improvement in lung function, as defined by an increase in FEV1. We analyzed 869 adult patients who were administered salbutamol after a methacholine challenge. To compare relative changes in PEF and FEV1 during bronchodilation, we used regression analysis and constructed a Bland and Altman plot. ROC analysis, sensitivity, specificity, positive and negative predictive values, and kappa coefficient assessed how precisely increases in PEF detected a 12% and 0.2-L improvement in FEV1. The average relative increase in FEV1 was significantly greater than that in PEF. The area under the curve in the ROC analysis was 0.844 for PEF change to detect a 12% and 0.2-L increase in FEV1. The kappa values for changes in PEF and FEV1 ranged from fair to moderate. BDR detected by the recommended 15% and 60 L/min cut-off for PEF identified less than half of true positives, while a 10% cut-off correctly identified close to 75% of them. PEF increase is not a reliable measure of BDR in comparison to FEV1 increase, and a 10% improvement in PEF was the least inaccurate cut-off. Substituting the PEF meter with a handheld spirometer should be further investigated for asthma home monitoring.

 求助内容:
求助内容: 应助结果提醒方式:


