Mingwei Liu, Erik J Timmermans, Alfred Wagtendonk, Paul Meijer, Diederick E Grobbee, Ilonca Vaartjes
{"title":"荷兰绿色空间可用性的社会人口和社会经济差异。","authors":"Mingwei Liu, Erik J Timmermans, Alfred Wagtendonk, Paul Meijer, Diederick E Grobbee, Ilonca Vaartjes","doi":"10.1007/s11111-025-00498-3","DOIUrl":null,"url":null,"abstract":"<p><p>We aimed to map the spatial distribution of green space in the Netherlands, and to first comprehensively assess socio-demographic and socio-economic differences in the availability of green space in the Netherlands. Data was analyzed from all registered residents of the Netherlands aged one and above on January 1, 2017 (16,440,620 individuals). Socio-demographic and socio-economic information was derived from Statistics Netherlands. Data on green space density (percent of the area) around home were assembled by the Institute for Public Health and the Environment at the address level. The distribution of exposure to green space was described by age groups, sex, ethnicity, household socioeconomic status (SES), and urbanicity degree, and stratified by green space type. The distribution of green space by all vegetation, trees, shrubs, low vegetation, grass field, and agriculture was mapped for the Netherlands in 2017. Small differences in green space density were found across age and sex groups. Ethnic Dutch (58.1%) and Indonesian (54.5%) had more green space coverage around residence than Turkish (50.0%) and Moroccan (50.0%). People with higher household SES generally had greater green space coverage, although it slightly decreased at the highest SES level. Higher urbanicity levels were monotonously associated with lower green space exposure. These differences particularly originated from differences in low vegetation. Observed differences between ethnic and SES groups originated mostly from differences in rural to moderately urbanized areas. Environmental injustice was found among ethnic, SES, and urbanicity groups. The differences were mostly present in low vegetation and in rural to moderately urbanized areas.</p>","PeriodicalId":47692,"journal":{"name":"Population and Environment","volume":"47 3","pages":"26"},"PeriodicalIF":2.5000,"publicationDate":"2025-01-01","publicationTypes":"Journal Article","fieldsOfStudy":null,"isOpenAccess":false,"openAccessPdf":"https://www.ncbi.nlm.nih.gov/pmc/articles/PMC12183132/pdf/","citationCount":"0","resultStr":"{\"title\":\"Socio-demographic and socio-economic differences in the availability of green space in the Netherlands.\",\"authors\":\"Mingwei Liu, Erik J Timmermans, Alfred Wagtendonk, Paul Meijer, Diederick E Grobbee, Ilonca Vaartjes\",\"doi\":\"10.1007/s11111-025-00498-3\",\"DOIUrl\":null,\"url\":null,\"abstract\":\"<p><p>We aimed to map the spatial distribution of green space in the Netherlands, and to first comprehensively assess socio-demographic and socio-economic differences in the availability of green space in the Netherlands. Data was analyzed from all registered residents of the Netherlands aged one and above on January 1, 2017 (16,440,620 individuals). Socio-demographic and socio-economic information was derived from Statistics Netherlands. Data on green space density (percent of the area) around home were assembled by the Institute for Public Health and the Environment at the address level. The distribution of exposure to green space was described by age groups, sex, ethnicity, household socioeconomic status (SES), and urbanicity degree, and stratified by green space type. The distribution of green space by all vegetation, trees, shrubs, low vegetation, grass field, and agriculture was mapped for the Netherlands in 2017. Small differences in green space density were found across age and sex groups. Ethnic Dutch (58.1%) and Indonesian (54.5%) had more green space coverage around residence than Turkish (50.0%) and Moroccan (50.0%). People with higher household SES generally had greater green space coverage, although it slightly decreased at the highest SES level. Higher urbanicity levels were monotonously associated with lower green space exposure. These differences particularly originated from differences in low vegetation. Observed differences between ethnic and SES groups originated mostly from differences in rural to moderately urbanized areas. Environmental injustice was found among ethnic, SES, and urbanicity groups. The differences were mostly present in low vegetation and in rural to moderately urbanized areas.</p>\",\"PeriodicalId\":47692,\"journal\":{\"name\":\"Population and Environment\",\"volume\":\"47 3\",\"pages\":\"26\"},\"PeriodicalIF\":2.5000,\"publicationDate\":\"2025-01-01\",\"publicationTypes\":\"Journal Article\",\"fieldsOfStudy\":null,\"isOpenAccess\":false,\"openAccessPdf\":\"https://www.ncbi.nlm.nih.gov/pmc/articles/PMC12183132/pdf/\",\"citationCount\":\"0\",\"resultStr\":null,\"platform\":\"Semanticscholar\",\"paperid\":null,\"PeriodicalName\":\"Population and Environment\",\"FirstCategoryId\":\"90\",\"ListUrlMain\":\"https://doi.org/10.1007/s11111-025-00498-3\",\"RegionNum\":3,\"RegionCategory\":\"社会学\",\"ArticlePicture\":[],\"TitleCN\":null,\"AbstractTextCN\":null,\"PMCID\":null,\"EPubDate\":\"2025/6/23 0:00:00\",\"PubModel\":\"Epub\",\"JCR\":\"Q1\",\"JCRName\":\"DEMOGRAPHY\",\"Score\":null,\"Total\":0}","platform":"Semanticscholar","paperid":null,"PeriodicalName":"Population and Environment","FirstCategoryId":"90","ListUrlMain":"https://doi.org/10.1007/s11111-025-00498-3","RegionNum":3,"RegionCategory":"社会学","ArticlePicture":[],"TitleCN":null,"AbstractTextCN":null,"PMCID":null,"EPubDate":"2025/6/23 0:00:00","PubModel":"Epub","JCR":"Q1","JCRName":"DEMOGRAPHY","Score":null,"Total":0}
Socio-demographic and socio-economic differences in the availability of green space in the Netherlands.
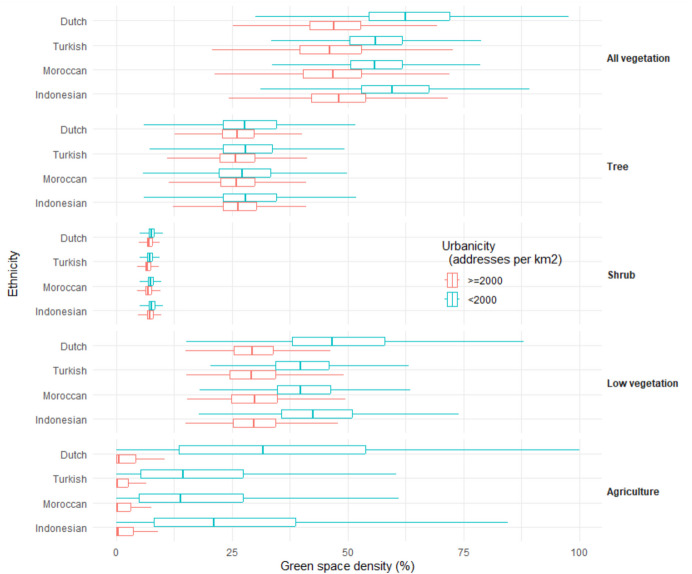
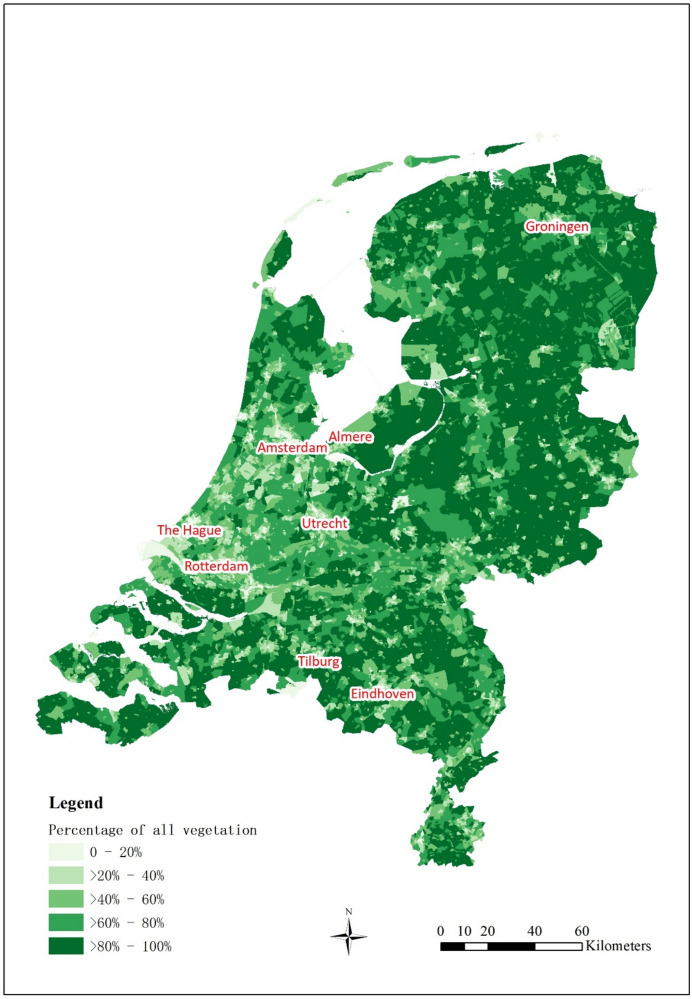
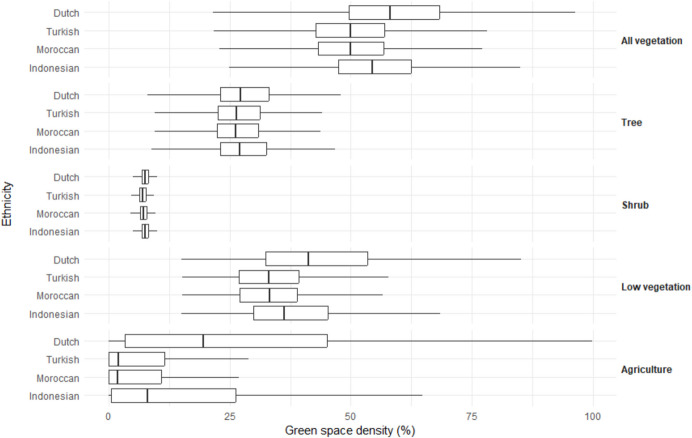
We aimed to map the spatial distribution of green space in the Netherlands, and to first comprehensively assess socio-demographic and socio-economic differences in the availability of green space in the Netherlands. Data was analyzed from all registered residents of the Netherlands aged one and above on January 1, 2017 (16,440,620 individuals). Socio-demographic and socio-economic information was derived from Statistics Netherlands. Data on green space density (percent of the area) around home were assembled by the Institute for Public Health and the Environment at the address level. The distribution of exposure to green space was described by age groups, sex, ethnicity, household socioeconomic status (SES), and urbanicity degree, and stratified by green space type. The distribution of green space by all vegetation, trees, shrubs, low vegetation, grass field, and agriculture was mapped for the Netherlands in 2017. Small differences in green space density were found across age and sex groups. Ethnic Dutch (58.1%) and Indonesian (54.5%) had more green space coverage around residence than Turkish (50.0%) and Moroccan (50.0%). People with higher household SES generally had greater green space coverage, although it slightly decreased at the highest SES level. Higher urbanicity levels were monotonously associated with lower green space exposure. These differences particularly originated from differences in low vegetation. Observed differences between ethnic and SES groups originated mostly from differences in rural to moderately urbanized areas. Environmental injustice was found among ethnic, SES, and urbanicity groups. The differences were mostly present in low vegetation and in rural to moderately urbanized areas.
期刊介绍:
Population & Environment is the sole social science journal focused on interdisciplinary research on social demographic aspects of environmental issues. The journal publishes cutting-edge research that contributes new insights on the complex, reciprocal links between human populations and the natural environment in all regions and countries of the world. Quantitative, qualitative or mixed methods contributions are welcome.
Disciplines commonly represented in the journal include demography, geography, sociology, human ecology, environmental economics, public health, anthropology and environmental studies. The journal publishes original research, research brief, and review articles.

 求助内容:
求助内容: 应助结果提醒方式:


