{"title":"神经元特异性烯醇化酶定量中适度溶血干扰校正的常规数据分析。","authors":"Leyre Ruiz, Tomás Munoz, Alvaro González, Estibaliz Alegre","doi":"10.11613/BM.2025.020802","DOIUrl":null,"url":null,"abstract":"<p><strong>Introduction: </strong>Serum neuron specific enolase (NSE) is used as neuroendocrine tumor and central nervous system damage marker. It is present in variable concentrations in erythrocytes and hemolysis interferes in serum NSE quantification. Our aim was to develop a correction formula for moderate hemolysis, based on repeated patient samples instead of artificial sample doping with hemolysates.</p><p><strong>Materials and methods: </strong>We searched in laboratory informatics system for patients with sample pairs obtained within 24 h, for NSE quantification. We registered NSE and hemolytic index (NSE1 and HI1) from the first moderate hemolyzed sample (HI: 15-80), and from the second non-hemolyzed sample obtained afterwards (NSE2 and HI2). In a development cohort (N = 41), we obtained the formula NSE<sub>calc</sub> = NSE1 - (0.354 x (HI1 - HI2)) - 0.162, which was later used in the validation cohort (N = 26) to calculate NSE corrected concentrations (NSE<sub>calc</sub>).</p><p><strong>Results: </strong>Concentrations of NSE2 differed from NSE1 (P = < 0.001) but not from NSE<sub>calc</sub> (P = 0.291). In 84% samples, NSE1 had a relative bias from NSE that exceeded the 14% limit of total error allowable, with a median relative bias of 22.5%. Meanwhile, the bias between NSE2 concentrations and NSE<sub>calc</sub> was - 0.4 µg/L (95% confidence interval = - 3.8 to 4.5), the relative bias was 8.3% and only 23% of samples exceeded the 14% limit. Formula usefulness was limited to moderate hemolytic samples.</p><p><strong>Conclusions: </strong>In summary, with this innovative approach, the NSE<sub>calc</sub> bias is low enough to have clinical significance, so re-drawings of blood samples might be avoided. This approach also opens the possibility to correct the estimation of other magnitude concentrations affected by <i>in vitro</i> hemolysis.</p>","PeriodicalId":94370,"journal":{"name":"Biochemia medica","volume":"35 2","pages":"020802"},"PeriodicalIF":1.8000,"publicationDate":"2025-06-15","publicationTypes":"Journal Article","fieldsOfStudy":null,"isOpenAccess":false,"openAccessPdf":"https://www.ncbi.nlm.nih.gov/pmc/articles/PMC12161513/pdf/","citationCount":"0","resultStr":"{\"title\":\"Routine data analysis for moderate hemolysis interference correction in neuron specific enolase quantification.\",\"authors\":\"Leyre Ruiz, Tomás Munoz, Alvaro González, Estibaliz Alegre\",\"doi\":\"10.11613/BM.2025.020802\",\"DOIUrl\":null,\"url\":null,\"abstract\":\"<p><strong>Introduction: </strong>Serum neuron specific enolase (NSE) is used as neuroendocrine tumor and central nervous system damage marker. It is present in variable concentrations in erythrocytes and hemolysis interferes in serum NSE quantification. Our aim was to develop a correction formula for moderate hemolysis, based on repeated patient samples instead of artificial sample doping with hemolysates.</p><p><strong>Materials and methods: </strong>We searched in laboratory informatics system for patients with sample pairs obtained within 24 h, for NSE quantification. We registered NSE and hemolytic index (NSE1 and HI1) from the first moderate hemolyzed sample (HI: 15-80), and from the second non-hemolyzed sample obtained afterwards (NSE2 and HI2). In a development cohort (N = 41), we obtained the formula NSE<sub>calc</sub> = NSE1 - (0.354 x (HI1 - HI2)) - 0.162, which was later used in the validation cohort (N = 26) to calculate NSE corrected concentrations (NSE<sub>calc</sub>).</p><p><strong>Results: </strong>Concentrations of NSE2 differed from NSE1 (P = < 0.001) but not from NSE<sub>calc</sub> (P = 0.291). In 84% samples, NSE1 had a relative bias from NSE that exceeded the 14% limit of total error allowable, with a median relative bias of 22.5%. Meanwhile, the bias between NSE2 concentrations and NSE<sub>calc</sub> was - 0.4 µg/L (95% confidence interval = - 3.8 to 4.5), the relative bias was 8.3% and only 23% of samples exceeded the 14% limit. Formula usefulness was limited to moderate hemolytic samples.</p><p><strong>Conclusions: </strong>In summary, with this innovative approach, the NSE<sub>calc</sub> bias is low enough to have clinical significance, so re-drawings of blood samples might be avoided. This approach also opens the possibility to correct the estimation of other magnitude concentrations affected by <i>in vitro</i> hemolysis.</p>\",\"PeriodicalId\":94370,\"journal\":{\"name\":\"Biochemia medica\",\"volume\":\"35 2\",\"pages\":\"020802\"},\"PeriodicalIF\":1.8000,\"publicationDate\":\"2025-06-15\",\"publicationTypes\":\"Journal Article\",\"fieldsOfStudy\":null,\"isOpenAccess\":false,\"openAccessPdf\":\"https://www.ncbi.nlm.nih.gov/pmc/articles/PMC12161513/pdf/\",\"citationCount\":\"0\",\"resultStr\":null,\"platform\":\"Semanticscholar\",\"paperid\":null,\"PeriodicalName\":\"Biochemia medica\",\"FirstCategoryId\":\"1085\",\"ListUrlMain\":\"https://doi.org/10.11613/BM.2025.020802\",\"RegionNum\":0,\"RegionCategory\":null,\"ArticlePicture\":[],\"TitleCN\":null,\"AbstractTextCN\":null,\"PMCID\":null,\"EPubDate\":\"\",\"PubModel\":\"\",\"JCR\":\"\",\"JCRName\":\"\",\"Score\":null,\"Total\":0}","platform":"Semanticscholar","paperid":null,"PeriodicalName":"Biochemia medica","FirstCategoryId":"1085","ListUrlMain":"https://doi.org/10.11613/BM.2025.020802","RegionNum":0,"RegionCategory":null,"ArticlePicture":[],"TitleCN":null,"AbstractTextCN":null,"PMCID":null,"EPubDate":"","PubModel":"","JCR":"","JCRName":"","Score":null,"Total":0}
Routine data analysis for moderate hemolysis interference correction in neuron specific enolase quantification.
Introduction: Serum neuron specific enolase (NSE) is used as neuroendocrine tumor and central nervous system damage marker. It is present in variable concentrations in erythrocytes and hemolysis interferes in serum NSE quantification. Our aim was to develop a correction formula for moderate hemolysis, based on repeated patient samples instead of artificial sample doping with hemolysates.
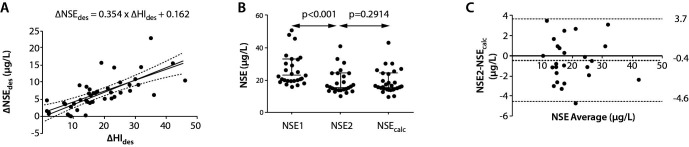
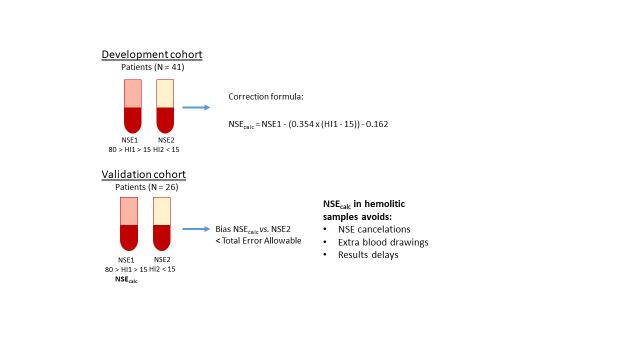
Materials and methods: We searched in laboratory informatics system for patients with sample pairs obtained within 24 h, for NSE quantification. We registered NSE and hemolytic index (NSE1 and HI1) from the first moderate hemolyzed sample (HI: 15-80), and from the second non-hemolyzed sample obtained afterwards (NSE2 and HI2). In a development cohort (N = 41), we obtained the formula NSEcalc = NSE1 - (0.354 x (HI1 - HI2)) - 0.162, which was later used in the validation cohort (N = 26) to calculate NSE corrected concentrations (NSEcalc).
Results: Concentrations of NSE2 differed from NSE1 (P = < 0.001) but not from NSEcalc (P = 0.291). In 84% samples, NSE1 had a relative bias from NSE that exceeded the 14% limit of total error allowable, with a median relative bias of 22.5%. Meanwhile, the bias between NSE2 concentrations and NSEcalc was - 0.4 µg/L (95% confidence interval = - 3.8 to 4.5), the relative bias was 8.3% and only 23% of samples exceeded the 14% limit. Formula usefulness was limited to moderate hemolytic samples.
Conclusions: In summary, with this innovative approach, the NSEcalc bias is low enough to have clinical significance, so re-drawings of blood samples might be avoided. This approach also opens the possibility to correct the estimation of other magnitude concentrations affected by in vitro hemolysis.

 求助内容:
求助内容: 应助结果提醒方式:


