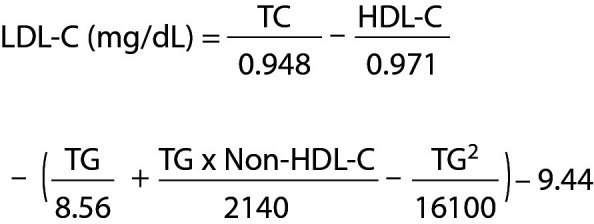
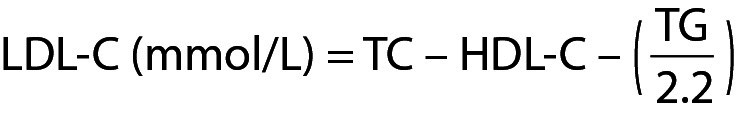
{"title":"根据Friedewald、Martin-Hopkins和Sampson/NIH方程估算的空腹时间对LDL胆固醇浓度的影响。","authors":"Şerif Ercan, Ali Manav","doi":"10.11613/BM.2025.020704","DOIUrl":null,"url":null,"abstract":"<p><strong>Introduction: </strong>A paradigm shift is occurring in lipid testing, as fasting is no longer required. We aimed to determine whether low-density lipoprotein cholesterol (LDL-C) concentrations calculated using three different equations, along with the components used in these calculations, vary with different fasting durations in routine clinical practice.</p><p><strong>Materials and methods: </strong>The concentrations of LDL-C were calculated using the Friedewald, Martin-Hopkins, and Sampson/NIH equations, along with the lipid components involved in these equations, depending on time since the last meal in a cohort of 77,300 outpatients at a community hospital. The study population was divided into groups according to fasting durations by 2-hour intervals. A general linear model was applied to identify differences between fasting and nonfasting groups.</p><p><strong>Results: </strong>Regardless of the calculation method, LDL-C concentrations varied with fasting duration for up to 8-10 hours. The greatest absolute mean differences in LDL-C concentrations between fasting and nonfasting states were - 0.32, - 0.30, and - 0.26 mmol/L when using the Friedewald, Sampson/NIH, and Martin-Hopkins equations, respectively. Among the equation components, triglyceride concentrations were the most sensitive to fasting duration, remaining elevated for 4-6 hours after the last meal, while total cholesterol and non-high-density lipoprotein cholesterol (HDL-C) concentrations decreased for up to 8-10 hours postprandially. However, HDL-C concentrations remained relatively stable.</p><p><strong>Conclusions: </strong>The variation in postprandial LDL-C concentrations was observed not to differ between the three calculation methods and reached negligible concentrations after at least 8 hours of fasting. If LDL-C concentrations measured in a nonfasting state are near clinical decision thresholds, subsequent lipid measurement should be performed in a fasting state.</p>","PeriodicalId":94370,"journal":{"name":"Biochemia medica","volume":"35 2","pages":"020704"},"PeriodicalIF":1.8000,"publicationDate":"2025-06-15","publicationTypes":"Journal Article","fieldsOfStudy":null,"isOpenAccess":false,"openAccessPdf":"https://www.ncbi.nlm.nih.gov/pmc/articles/PMC12131409/pdf/","citationCount":"0","resultStr":"{\"title\":\"Impact of fasting duration on LDL cholesterol concentrations estimated by the Friedewald, Martin-Hopkins, and Sampson/NIH equations.\",\"authors\":\"Şerif Ercan, Ali Manav\",\"doi\":\"10.11613/BM.2025.020704\",\"DOIUrl\":null,\"url\":null,\"abstract\":\"<p><strong>Introduction: </strong>A paradigm shift is occurring in lipid testing, as fasting is no longer required. We aimed to determine whether low-density lipoprotein cholesterol (LDL-C) concentrations calculated using three different equations, along with the components used in these calculations, vary with different fasting durations in routine clinical practice.</p><p><strong>Materials and methods: </strong>The concentrations of LDL-C were calculated using the Friedewald, Martin-Hopkins, and Sampson/NIH equations, along with the lipid components involved in these equations, depending on time since the last meal in a cohort of 77,300 outpatients at a community hospital. The study population was divided into groups according to fasting durations by 2-hour intervals. A general linear model was applied to identify differences between fasting and nonfasting groups.</p><p><strong>Results: </strong>Regardless of the calculation method, LDL-C concentrations varied with fasting duration for up to 8-10 hours. The greatest absolute mean differences in LDL-C concentrations between fasting and nonfasting states were - 0.32, - 0.30, and - 0.26 mmol/L when using the Friedewald, Sampson/NIH, and Martin-Hopkins equations, respectively. Among the equation components, triglyceride concentrations were the most sensitive to fasting duration, remaining elevated for 4-6 hours after the last meal, while total cholesterol and non-high-density lipoprotein cholesterol (HDL-C) concentrations decreased for up to 8-10 hours postprandially. However, HDL-C concentrations remained relatively stable.</p><p><strong>Conclusions: </strong>The variation in postprandial LDL-C concentrations was observed not to differ between the three calculation methods and reached negligible concentrations after at least 8 hours of fasting. If LDL-C concentrations measured in a nonfasting state are near clinical decision thresholds, subsequent lipid measurement should be performed in a fasting state.</p>\",\"PeriodicalId\":94370,\"journal\":{\"name\":\"Biochemia medica\",\"volume\":\"35 2\",\"pages\":\"020704\"},\"PeriodicalIF\":1.8000,\"publicationDate\":\"2025-06-15\",\"publicationTypes\":\"Journal Article\",\"fieldsOfStudy\":null,\"isOpenAccess\":false,\"openAccessPdf\":\"https://www.ncbi.nlm.nih.gov/pmc/articles/PMC12131409/pdf/\",\"citationCount\":\"0\",\"resultStr\":null,\"platform\":\"Semanticscholar\",\"paperid\":null,\"PeriodicalName\":\"Biochemia medica\",\"FirstCategoryId\":\"1085\",\"ListUrlMain\":\"https://doi.org/10.11613/BM.2025.020704\",\"RegionNum\":0,\"RegionCategory\":null,\"ArticlePicture\":[],\"TitleCN\":null,\"AbstractTextCN\":null,\"PMCID\":null,\"EPubDate\":\"2025/4/15 0:00:00\",\"PubModel\":\"Epub\",\"JCR\":\"\",\"JCRName\":\"\",\"Score\":null,\"Total\":0}","platform":"Semanticscholar","paperid":null,"PeriodicalName":"Biochemia medica","FirstCategoryId":"1085","ListUrlMain":"https://doi.org/10.11613/BM.2025.020704","RegionNum":0,"RegionCategory":null,"ArticlePicture":[],"TitleCN":null,"AbstractTextCN":null,"PMCID":null,"EPubDate":"2025/4/15 0:00:00","PubModel":"Epub","JCR":"","JCRName":"","Score":null,"Total":0}
Impact of fasting duration on LDL cholesterol concentrations estimated by the Friedewald, Martin-Hopkins, and Sampson/NIH equations.
Introduction: A paradigm shift is occurring in lipid testing, as fasting is no longer required. We aimed to determine whether low-density lipoprotein cholesterol (LDL-C) concentrations calculated using three different equations, along with the components used in these calculations, vary with different fasting durations in routine clinical practice.
Materials and methods: The concentrations of LDL-C were calculated using the Friedewald, Martin-Hopkins, and Sampson/NIH equations, along with the lipid components involved in these equations, depending on time since the last meal in a cohort of 77,300 outpatients at a community hospital. The study population was divided into groups according to fasting durations by 2-hour intervals. A general linear model was applied to identify differences between fasting and nonfasting groups.
Results: Regardless of the calculation method, LDL-C concentrations varied with fasting duration for up to 8-10 hours. The greatest absolute mean differences in LDL-C concentrations between fasting and nonfasting states were - 0.32, - 0.30, and - 0.26 mmol/L when using the Friedewald, Sampson/NIH, and Martin-Hopkins equations, respectively. Among the equation components, triglyceride concentrations were the most sensitive to fasting duration, remaining elevated for 4-6 hours after the last meal, while total cholesterol and non-high-density lipoprotein cholesterol (HDL-C) concentrations decreased for up to 8-10 hours postprandially. However, HDL-C concentrations remained relatively stable.
Conclusions: The variation in postprandial LDL-C concentrations was observed not to differ between the three calculation methods and reached negligible concentrations after at least 8 hours of fasting. If LDL-C concentrations measured in a nonfasting state are near clinical decision thresholds, subsequent lipid measurement should be performed in a fasting state.


 求助内容:
求助内容: 应助结果提醒方式:


