{"title":"生态系统服务价值空间分布格局的尺度依赖性研究——以甘谷县为例","authors":"Yingying Wu, Xuelu Liu, Qiqi Zhao, Hongyan Liu, Fei Qu, Miaomiao Zhang","doi":"10.1038/s41598-025-03497-4","DOIUrl":null,"url":null,"abstract":"<p><p>This article aims to screen out the critical and optimal scales of the total value and spatial differentiation of ecosystem service value (ESV) to improve the accuracy and reliability of the ESV assessment results. On the basis of LULC data form 2000 to 2005, 2010, 2015, and 2020, we analyzed and explored the variation in the total value of ESVs and its critical scales in Gangu County by using the equivalent factor method and nonparametric tests. The optimal grid scale for the spatial differentiation of ESV is determined with the help of the method of coefficient of variation and Moran index. The spatial distribution pattern of ESV during the period of 2000-2020 under the optimal scale is described according to the method of spatial autocorrelation analysis. The results show that: (1) The total value of ESV for the five periods from 2000 to 2020 shows an overall upward trend with increasing scale. The total value of ESV in 2000, 2005, and 2010 is not significantly different after the 1100 m scale. The total value of ESV in 2015 and 2020 is not significantly different after the 1000 m scale. The 1100 m grid scale is a uniform critical scale for studying the total value of ESV with or without scale dependence. (2) When the total value of ESV is stabilized, the spatial distribution pattern of ESV under different levels has a significant scale dependence. The area proportion of the medium level is dominant. There is no significant difference in the spatial distribution patterns of ESVs after the 1700 m scale, and the scale dependence disappears. 5-period coefficient of variation values are small in the range of 1900-2100 m scale. Moran's I values are all> 0.5 and reach the peak in the 1900m scale. 1900 m grid scale is the optimal scale for exploring the spatial distribution pattern of ESV. (3) At the best scale, the ESV in Gangu County shows an overall distribution pattern of south-high and north-low. It is dominated by medium values and focused in the middle and north of the study region. From 2000 to 2020, the spatial distribution of ESVs primarily devolved from high to low values and decreased from southern to northern, and ESV is dominated by high-high agglomeration. In summary, there is a significant scale dependence in both the total value of ESV and the scale of spatial differentiation. Different scale choices will affect the accuracy of the evaluation results. Selecting the optimal grid scale in combination with specific research needs can provide a prerequisite for the future scientific quantification of ESV in Gangu County.</p>","PeriodicalId":21811,"journal":{"name":"Scientific Reports","volume":"15 1","pages":"18671"},"PeriodicalIF":3.9000,"publicationDate":"2025-05-28","publicationTypes":"Journal Article","fieldsOfStudy":null,"isOpenAccess":false,"openAccessPdf":"https://www.ncbi.nlm.nih.gov/pmc/articles/PMC12119913/pdf/","citationCount":"0","resultStr":"{\"title\":\"Study on the scale dependence of the spatial distribution pattern of ecosystem service value - a case study of Gangu County, China.\",\"authors\":\"Yingying Wu, Xuelu Liu, Qiqi Zhao, Hongyan Liu, Fei Qu, Miaomiao Zhang\",\"doi\":\"10.1038/s41598-025-03497-4\",\"DOIUrl\":null,\"url\":null,\"abstract\":\"<p><p>This article aims to screen out the critical and optimal scales of the total value and spatial differentiation of ecosystem service value (ESV) to improve the accuracy and reliability of the ESV assessment results. On the basis of LULC data form 2000 to 2005, 2010, 2015, and 2020, we analyzed and explored the variation in the total value of ESVs and its critical scales in Gangu County by using the equivalent factor method and nonparametric tests. The optimal grid scale for the spatial differentiation of ESV is determined with the help of the method of coefficient of variation and Moran index. The spatial distribution pattern of ESV during the period of 2000-2020 under the optimal scale is described according to the method of spatial autocorrelation analysis. The results show that: (1) The total value of ESV for the five periods from 2000 to 2020 shows an overall upward trend with increasing scale. The total value of ESV in 2000, 2005, and 2010 is not significantly different after the 1100 m scale. The total value of ESV in 2015 and 2020 is not significantly different after the 1000 m scale. The 1100 m grid scale is a uniform critical scale for studying the total value of ESV with or without scale dependence. (2) When the total value of ESV is stabilized, the spatial distribution pattern of ESV under different levels has a significant scale dependence. The area proportion of the medium level is dominant. There is no significant difference in the spatial distribution patterns of ESVs after the 1700 m scale, and the scale dependence disappears. 5-period coefficient of variation values are small in the range of 1900-2100 m scale. Moran's I values are all> 0.5 and reach the peak in the 1900m scale. 1900 m grid scale is the optimal scale for exploring the spatial distribution pattern of ESV. (3) At the best scale, the ESV in Gangu County shows an overall distribution pattern of south-high and north-low. It is dominated by medium values and focused in the middle and north of the study region. From 2000 to 2020, the spatial distribution of ESVs primarily devolved from high to low values and decreased from southern to northern, and ESV is dominated by high-high agglomeration. In summary, there is a significant scale dependence in both the total value of ESV and the scale of spatial differentiation. Different scale choices will affect the accuracy of the evaluation results. Selecting the optimal grid scale in combination with specific research needs can provide a prerequisite for the future scientific quantification of ESV in Gangu County.</p>\",\"PeriodicalId\":21811,\"journal\":{\"name\":\"Scientific Reports\",\"volume\":\"15 1\",\"pages\":\"18671\"},\"PeriodicalIF\":3.9000,\"publicationDate\":\"2025-05-28\",\"publicationTypes\":\"Journal Article\",\"fieldsOfStudy\":null,\"isOpenAccess\":false,\"openAccessPdf\":\"https://www.ncbi.nlm.nih.gov/pmc/articles/PMC12119913/pdf/\",\"citationCount\":\"0\",\"resultStr\":null,\"platform\":\"Semanticscholar\",\"paperid\":null,\"PeriodicalName\":\"Scientific Reports\",\"FirstCategoryId\":\"103\",\"ListUrlMain\":\"https://doi.org/10.1038/s41598-025-03497-4\",\"RegionNum\":2,\"RegionCategory\":\"综合性期刊\",\"ArticlePicture\":[],\"TitleCN\":null,\"AbstractTextCN\":null,\"PMCID\":null,\"EPubDate\":\"\",\"PubModel\":\"\",\"JCR\":\"Q1\",\"JCRName\":\"MULTIDISCIPLINARY SCIENCES\",\"Score\":null,\"Total\":0}","platform":"Semanticscholar","paperid":null,"PeriodicalName":"Scientific Reports","FirstCategoryId":"103","ListUrlMain":"https://doi.org/10.1038/s41598-025-03497-4","RegionNum":2,"RegionCategory":"综合性期刊","ArticlePicture":[],"TitleCN":null,"AbstractTextCN":null,"PMCID":null,"EPubDate":"","PubModel":"","JCR":"Q1","JCRName":"MULTIDISCIPLINARY SCIENCES","Score":null,"Total":0}
Study on the scale dependence of the spatial distribution pattern of ecosystem service value - a case study of Gangu County, China.
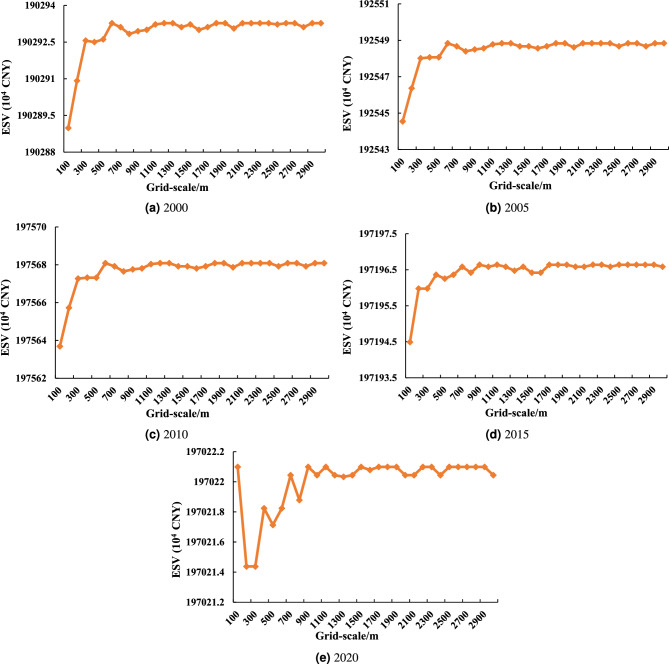
This article aims to screen out the critical and optimal scales of the total value and spatial differentiation of ecosystem service value (ESV) to improve the accuracy and reliability of the ESV assessment results. On the basis of LULC data form 2000 to 2005, 2010, 2015, and 2020, we analyzed and explored the variation in the total value of ESVs and its critical scales in Gangu County by using the equivalent factor method and nonparametric tests. The optimal grid scale for the spatial differentiation of ESV is determined with the help of the method of coefficient of variation and Moran index. The spatial distribution pattern of ESV during the period of 2000-2020 under the optimal scale is described according to the method of spatial autocorrelation analysis. The results show that: (1) The total value of ESV for the five periods from 2000 to 2020 shows an overall upward trend with increasing scale. The total value of ESV in 2000, 2005, and 2010 is not significantly different after the 1100 m scale. The total value of ESV in 2015 and 2020 is not significantly different after the 1000 m scale. The 1100 m grid scale is a uniform critical scale for studying the total value of ESV with or without scale dependence. (2) When the total value of ESV is stabilized, the spatial distribution pattern of ESV under different levels has a significant scale dependence. The area proportion of the medium level is dominant. There is no significant difference in the spatial distribution patterns of ESVs after the 1700 m scale, and the scale dependence disappears. 5-period coefficient of variation values are small in the range of 1900-2100 m scale. Moran's I values are all> 0.5 and reach the peak in the 1900m scale. 1900 m grid scale is the optimal scale for exploring the spatial distribution pattern of ESV. (3) At the best scale, the ESV in Gangu County shows an overall distribution pattern of south-high and north-low. It is dominated by medium values and focused in the middle and north of the study region. From 2000 to 2020, the spatial distribution of ESVs primarily devolved from high to low values and decreased from southern to northern, and ESV is dominated by high-high agglomeration. In summary, there is a significant scale dependence in both the total value of ESV and the scale of spatial differentiation. Different scale choices will affect the accuracy of the evaluation results. Selecting the optimal grid scale in combination with specific research needs can provide a prerequisite for the future scientific quantification of ESV in Gangu County.
期刊介绍:
We publish original research from all areas of the natural sciences, psychology, medicine and engineering. You can learn more about what we publish by browsing our specific scientific subject areas below or explore Scientific Reports by browsing all articles and collections.
Scientific Reports has a 2-year impact factor: 4.380 (2021), and is the 6th most-cited journal in the world, with more than 540,000 citations in 2020 (Clarivate Analytics, 2021).
•Engineering
Engineering covers all aspects of engineering, technology, and applied science. It plays a crucial role in the development of technologies to address some of the world''s biggest challenges, helping to save lives and improve the way we live.
•Physical sciences
Physical sciences are those academic disciplines that aim to uncover the underlying laws of nature — often written in the language of mathematics. It is a collective term for areas of study including astronomy, chemistry, materials science and physics.
•Earth and environmental sciences
Earth and environmental sciences cover all aspects of Earth and planetary science and broadly encompass solid Earth processes, surface and atmospheric dynamics, Earth system history, climate and climate change, marine and freshwater systems, and ecology. It also considers the interactions between humans and these systems.
•Biological sciences
Biological sciences encompass all the divisions of natural sciences examining various aspects of vital processes. The concept includes anatomy, physiology, cell biology, biochemistry and biophysics, and covers all organisms from microorganisms, animals to plants.
•Health sciences
The health sciences study health, disease and healthcare. This field of study aims to develop knowledge, interventions and technology for use in healthcare to improve the treatment of patients.

 求助内容:
求助内容: 应助结果提醒方式:


