{"title":"未来土地利用和土地覆盖变化对洪峰影响的预测——以埃塞俄比亚Tekeze盆地Babur流域为例","authors":"Kahsu Hubot, Haddush Goitom, Gebremeskel Aregay, Teame Yisfa","doi":"10.1111/jfr3.70077","DOIUrl":null,"url":null,"abstract":"<p>Land use land cover (LULC) classification has been widely studied in remote sensing and GIS for agricultural, ecological, and hydrological processes. This study mainly focused on the prediction of the future impact of LULC change on peak stream flow through quantum GIS (QGIS) with the MOLUSCE plugin for LULC prediction, Geographical Information System (GIS) integrated with the HEC-GeoHMS to prepare input data, and HEC-HMS for hydrologic modeling. ERDAS IMAGINE was used to classify the watershed into six major LULC classes. Based on the Landsat image analyses for 1996–2016, the cropland area, built-up area and vegetation had increased within two decades, and the annual rate of change was 0.11%, 0.83%, and 0.36%, respectively. However, forestland, shrubland, and bareland decreased at an annual rate of change of 0.26%, 0.21%, and 1.56%, respectively. The statistical downscaling model (SDSM) was used for the prediction of future rainfall of the Babur watershed, which helps to predict its future peak stream flow. The performance of the HEC-HMS model was evaluated through sensitivity analysis, calibration, and validation. Both the calibration (1992–1998) and validation (1999–2001) results showed a good match between measured and simulated flow data with the coefficient of determination (<i>R</i><sup>2</sup>) of 0.72, percent of bias (PBIAS) of 1.60%, root mean square error (RMSE) of 0.5, and Nash–Sutcliffe efficiency (NSE) of 0.774 for the calibration, and <i>R</i><sup>2</sup> of 0.86, PBIAS of −9.54%, RMSE of 0.4, and NSE of 0.842 for the validation period. Because of the change in LULC, the peak flow has increased by 19.33% and 45.91% during 1996–2016 and 2016–2036, respectively.</p>","PeriodicalId":49294,"journal":{"name":"Journal of Flood Risk Management","volume":"18 2","pages":""},"PeriodicalIF":3.0000,"publicationDate":"2025-05-29","publicationTypes":"Journal Article","fieldsOfStudy":null,"isOpenAccess":false,"openAccessPdf":"https://onlinelibrary.wiley.com/doi/epdf/10.1111/jfr3.70077","citationCount":"0","resultStr":"{\"title\":\"Prediction of Future Land Use and Land Cover Change Impact on Peak Flood: In Case of Babur Watershed, Tekeze Basin, Ethiopia\",\"authors\":\"Kahsu Hubot, Haddush Goitom, Gebremeskel Aregay, Teame Yisfa\",\"doi\":\"10.1111/jfr3.70077\",\"DOIUrl\":null,\"url\":null,\"abstract\":\"<p>Land use land cover (LULC) classification has been widely studied in remote sensing and GIS for agricultural, ecological, and hydrological processes. This study mainly focused on the prediction of the future impact of LULC change on peak stream flow through quantum GIS (QGIS) with the MOLUSCE plugin for LULC prediction, Geographical Information System (GIS) integrated with the HEC-GeoHMS to prepare input data, and HEC-HMS for hydrologic modeling. ERDAS IMAGINE was used to classify the watershed into six major LULC classes. Based on the Landsat image analyses for 1996–2016, the cropland area, built-up area and vegetation had increased within two decades, and the annual rate of change was 0.11%, 0.83%, and 0.36%, respectively. However, forestland, shrubland, and bareland decreased at an annual rate of change of 0.26%, 0.21%, and 1.56%, respectively. The statistical downscaling model (SDSM) was used for the prediction of future rainfall of the Babur watershed, which helps to predict its future peak stream flow. The performance of the HEC-HMS model was evaluated through sensitivity analysis, calibration, and validation. Both the calibration (1992–1998) and validation (1999–2001) results showed a good match between measured and simulated flow data with the coefficient of determination (<i>R</i><sup>2</sup>) of 0.72, percent of bias (PBIAS) of 1.60%, root mean square error (RMSE) of 0.5, and Nash–Sutcliffe efficiency (NSE) of 0.774 for the calibration, and <i>R</i><sup>2</sup> of 0.86, PBIAS of −9.54%, RMSE of 0.4, and NSE of 0.842 for the validation period. Because of the change in LULC, the peak flow has increased by 19.33% and 45.91% during 1996–2016 and 2016–2036, respectively.</p>\",\"PeriodicalId\":49294,\"journal\":{\"name\":\"Journal of Flood Risk Management\",\"volume\":\"18 2\",\"pages\":\"\"},\"PeriodicalIF\":3.0000,\"publicationDate\":\"2025-05-29\",\"publicationTypes\":\"Journal Article\",\"fieldsOfStudy\":null,\"isOpenAccess\":false,\"openAccessPdf\":\"https://onlinelibrary.wiley.com/doi/epdf/10.1111/jfr3.70077\",\"citationCount\":\"0\",\"resultStr\":null,\"platform\":\"Semanticscholar\",\"paperid\":null,\"PeriodicalName\":\"Journal of Flood Risk Management\",\"FirstCategoryId\":\"93\",\"ListUrlMain\":\"https://onlinelibrary.wiley.com/doi/10.1111/jfr3.70077\",\"RegionNum\":3,\"RegionCategory\":\"环境科学与生态学\",\"ArticlePicture\":[],\"TitleCN\":null,\"AbstractTextCN\":null,\"PMCID\":null,\"EPubDate\":\"\",\"PubModel\":\"\",\"JCR\":\"Q2\",\"JCRName\":\"ENVIRONMENTAL SCIENCES\",\"Score\":null,\"Total\":0}","platform":"Semanticscholar","paperid":null,"PeriodicalName":"Journal of Flood Risk Management","FirstCategoryId":"93","ListUrlMain":"https://onlinelibrary.wiley.com/doi/10.1111/jfr3.70077","RegionNum":3,"RegionCategory":"环境科学与生态学","ArticlePicture":[],"TitleCN":null,"AbstractTextCN":null,"PMCID":null,"EPubDate":"","PubModel":"","JCR":"Q2","JCRName":"ENVIRONMENTAL SCIENCES","Score":null,"Total":0}
Prediction of Future Land Use and Land Cover Change Impact on Peak Flood: In Case of Babur Watershed, Tekeze Basin, Ethiopia
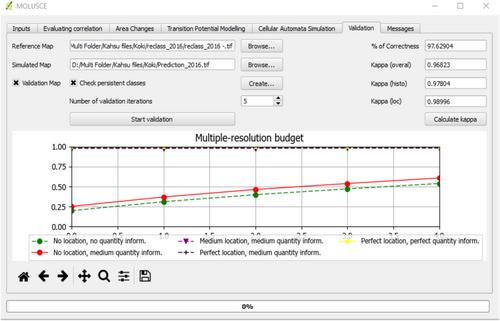
Land use land cover (LULC) classification has been widely studied in remote sensing and GIS for agricultural, ecological, and hydrological processes. This study mainly focused on the prediction of the future impact of LULC change on peak stream flow through quantum GIS (QGIS) with the MOLUSCE plugin for LULC prediction, Geographical Information System (GIS) integrated with the HEC-GeoHMS to prepare input data, and HEC-HMS for hydrologic modeling. ERDAS IMAGINE was used to classify the watershed into six major LULC classes. Based on the Landsat image analyses for 1996–2016, the cropland area, built-up area and vegetation had increased within two decades, and the annual rate of change was 0.11%, 0.83%, and 0.36%, respectively. However, forestland, shrubland, and bareland decreased at an annual rate of change of 0.26%, 0.21%, and 1.56%, respectively. The statistical downscaling model (SDSM) was used for the prediction of future rainfall of the Babur watershed, which helps to predict its future peak stream flow. The performance of the HEC-HMS model was evaluated through sensitivity analysis, calibration, and validation. Both the calibration (1992–1998) and validation (1999–2001) results showed a good match between measured and simulated flow data with the coefficient of determination (R2) of 0.72, percent of bias (PBIAS) of 1.60%, root mean square error (RMSE) of 0.5, and Nash–Sutcliffe efficiency (NSE) of 0.774 for the calibration, and R2 of 0.86, PBIAS of −9.54%, RMSE of 0.4, and NSE of 0.842 for the validation period. Because of the change in LULC, the peak flow has increased by 19.33% and 45.91% during 1996–2016 and 2016–2036, respectively.
期刊介绍:
Journal of Flood Risk Management provides an international platform for knowledge sharing in all areas related to flood risk. Its explicit aim is to disseminate ideas across the range of disciplines where flood related research is carried out and it provides content ranging from leading edge academic papers to applied content with the practitioner in mind.
Readers and authors come from a wide background and include hydrologists, meteorologists, geographers, geomorphologists, conservationists, civil engineers, social scientists, policy makers, insurers and practitioners. They share an interest in managing the complex interactions between the many skills and disciplines that underpin the management of flood risk across the world.
 求助内容:
求助内容: 应助结果提醒方式:


