{"title":"更正“通过开环复分解聚合化学可回收的高摩尔质量聚恶唑烷酮”","authors":"Arpan Pal, Allison R. Wong, Jessica R. Lamb","doi":"10.1021/acsmacrolett.5c00318","DOIUrl":null,"url":null,"abstract":"In our original publication, the <sup>13</sup>C NMR spectra that were used for microstructure assignment and quantification lacked resolution of all eight signals that arise from a mixture of <i>E</i>- and <i>Z</i>-alkenes as well as head-to-tail (HT), head-to-head (HH), and tail-to-tail (TT) regioisomeric linkages. The signal-to-noise of the original band-selective HMBC NMR spectra showed HT cross peaks for the more prominent <sup>13</sup>C NMR peaks and did not show these cross peaks for the lower intensity <sup>13</sup>C NMR peaks, leading us to our original peak assignments. Subsequently acquired spectra for <b>P3</b> detected two overlapping peaks at 130.02 and 129.97 ppm that were previously not resolved. A band-selective HMBC spectrum using a higher field instrument (900 vs 500 MHz in our original publication) indicated the microstructures in our original publication were assigned incorrectly from the lower resolution spectra. The major versus minor peaks in the <sup>13</sup>C NMR spectra arise from differences in alkene geometry rather than from regiochemistry, as originally reported. The microstructure of <b>P3</b> consists of 67% HT and 33% HH+TT linkages (quantified from the peaks at 130.02 and 129.97 ppm) as well as 86% <i>E</i>- and 14% <i>Z</i>-alkenes (assigned from the relative intensity of the peaks in the IR spectrum and quantified using all peaks). Newly acquired <sup>13</sup>C NMR spectra of <b>P2</b> and <b>P4</b> unfortunately did not have an analogous increase in resolution, even when acquired on a 900 MHz instrument. While the lower resolution for these polymers prevents the assignment of regiochemistry, the alkene geometry has been corrected to 84% and 78% <i>E</i>-alkenes for <b>P2</b> and <b>P4</b>, respectively. The overall conclusions of the work are not affected except for the microstructure analysis. In the main text, this section should now read: “Because these Oxa-fused COE monomers are unsymmetrical, we attempted to characterize the regioregularity of enchainment for <b>M2</b>–<b>M4</b> using IR and NMR spectroscopies. There was insufficient resolution in the <sup>13</sup>C NMR spectra to characterize the regioselectivity of <b>M2</b> and <b>M4</b>, but <b>M3</b> showed 67% head-to-tail enchainment (see Section S2E for more details)”. In the Supporting Information, this section (Section S2E) on page S11 should now read “We therefore acquired a quantitative <sup>13</sup>C NMR spectrum using a 20 s relaxation delay (Figure S14D,E), which determined <b>P3</b> contains 67% HT and 33% HH+TT linkages as well as 86% <i>E</i>- and 14% <i>Z</i>-alkenes.” On page S12, this section should now read “An analogous analysis was performed for <b>P2</b> ... and <b>P4</b> ... to determine the microstructure. While the regiochemistry of enchainment could not be determined due to insufficient resolution in the <sup>13</sup>C NMR spectra, <b>P2</b> was found to have 84% <i>E</i>-alkenes and <b>P4</b> to have 78% <i>E</i>-alkenes”. Figure S13. Band-selective HMBC (900 and 226 MHz, CDCl<sub>3</sub>) of <b>P3</b> with correlations highlighted with solid (<i>E</i>-alkenes) and dashed (<i>Z</i>-alkenes) lines. Correlations on the nitrogen (H) side are in blue, on the oxygen (T) side in red, and between sides in purple for the HT regioisomer. Figure S14. Partial <sup>13</sup>C NMR spectrum (151 MHz, CDCl<sub>3</sub>) of <b>P3</b> acquired with (A) 2 s, (B, D, E) 20 s, and (C) 30 s relaxation delays using the Bruker zgig30 pulse sequence and (A–C) 128 or (D, E) 1275 scans. The peaks in Part D were fit in MestReNova using a generalized Lorentzian peak shape with the integrals for the peaks at 130.02 and 129.97 ppm (used to quantify regiochemistry) given in Table S8. The deconvoluted peaks are shown in blue, the sum in pink, and the residuals in red. The peaks in Part E were integrated using the standard integration feature in MestReNova for the quantification of the alkene geometry. The corrected versions of Figures S13, S14, S19, and S25, along with the corrected captions for Figures S20 and S26 are presented here. New Table S8 tabulates the integrations of the deconvoluted quantitative <sup>13</sup>C NMR peaks for <b>P3</b>, and new Figure S49 shows unresolved alkene peaks for <b>P2</b> and <b>P4</b> in the <sup>13</sup>C NMR spectra using a 900 MHz instrument.<named-content content-type=\"anchor\" r type=\"simple\"></named-content><named-content content-type=\"anchor\" r type=\"simple\"></named-content><named-content content-type=\"anchor\" r type=\"simple\"></named-content><named-content content-type=\"anchor\" r type=\"simple\"></named-content><named-content content-type=\"anchor\" r type=\"simple\"></named-content><named-content content-type=\"anchor\" r type=\"simple\"></named-content><named-content content-type=\"anchor\" r type=\"simple\"></named-content> Figure S19. Band-selective HMBC spectrum (500 and 126 MHz, CDCl<sub>3</sub>) of <b>P2</b>. Figure S20. Partial <sup>13</sup>C NMR (151 MHz, CDCl<sub>3</sub>, 20 s relaxation delay) spectrum of olefin region of <b>P2</b> used to quantify the ratio of <i>E</i>- and <i>Z</i>-alkenes. Figure S25. Band-selective HMBC spectrum (500 and 126 MHz, CDCl<sub>3</sub>) of <b>P4</b>. Figure S26. Partial <sup>13</sup>C NMR (151 MHz, CDCl<sub>3</sub>, 60 s relaxation delay) spectrum of olefin region of <b>P4</b> used to quantify the ratio of <i>E</i>- and <i>Z</i>-alkenes. Determined in MestReNova from line fitting with a generalized Lorentzian peak shape. Normalized by the number of C atoms (i.e., 1 for HT or 2 for TT). Figure S49. Partial <sup>13</sup>C NMR spectra (226 MHz, CDCl<sub>3</sub>) of (A) <b>P2</b> and (B) <b>P4</b> showing the alkene peaks were unresolved even at a higher field. The higher field spectra were recorded on a Bruker 900 MHz Avance III instrument with a TCI cryoprobe [(<sup>1</sup>H, 900 MHz), (<sup>13</sup>C, 226 MHz)] at 22 °C. This article has not yet been cited by other publications.","PeriodicalId":18,"journal":{"name":"ACS Macro Letters","volume":"58 1","pages":""},"PeriodicalIF":5.2000,"publicationDate":"2025-05-29","publicationTypes":"Journal Article","fieldsOfStudy":null,"isOpenAccess":false,"openAccessPdf":"","citationCount":"0","resultStr":"{\"title\":\"Correction to “Chemically Recyclable, High Molar Mass Polyoxazolidinones via Ring-Opening Metathesis Polymerization”\",\"authors\":\"Arpan Pal, Allison R. Wong, Jessica R. Lamb\",\"doi\":\"10.1021/acsmacrolett.5c00318\",\"DOIUrl\":null,\"url\":null,\"abstract\":\"In our original publication, the <sup>13</sup>C NMR spectra that were used for microstructure assignment and quantification lacked resolution of all eight signals that arise from a mixture of <i>E</i>- and <i>Z</i>-alkenes as well as head-to-tail (HT), head-to-head (HH), and tail-to-tail (TT) regioisomeric linkages. The signal-to-noise of the original band-selective HMBC NMR spectra showed HT cross peaks for the more prominent <sup>13</sup>C NMR peaks and did not show these cross peaks for the lower intensity <sup>13</sup>C NMR peaks, leading us to our original peak assignments. Subsequently acquired spectra for <b>P3</b> detected two overlapping peaks at 130.02 and 129.97 ppm that were previously not resolved. A band-selective HMBC spectrum using a higher field instrument (900 vs 500 MHz in our original publication) indicated the microstructures in our original publication were assigned incorrectly from the lower resolution spectra. The major versus minor peaks in the <sup>13</sup>C NMR spectra arise from differences in alkene geometry rather than from regiochemistry, as originally reported. The microstructure of <b>P3</b> consists of 67% HT and 33% HH+TT linkages (quantified from the peaks at 130.02 and 129.97 ppm) as well as 86% <i>E</i>- and 14% <i>Z</i>-alkenes (assigned from the relative intensity of the peaks in the IR spectrum and quantified using all peaks). Newly acquired <sup>13</sup>C NMR spectra of <b>P2</b> and <b>P4</b> unfortunately did not have an analogous increase in resolution, even when acquired on a 900 MHz instrument. While the lower resolution for these polymers prevents the assignment of regiochemistry, the alkene geometry has been corrected to 84% and 78% <i>E</i>-alkenes for <b>P2</b> and <b>P4</b>, respectively. The overall conclusions of the work are not affected except for the microstructure analysis. In the main text, this section should now read: “Because these Oxa-fused COE monomers are unsymmetrical, we attempted to characterize the regioregularity of enchainment for <b>M2</b>–<b>M4</b> using IR and NMR spectroscopies. There was insufficient resolution in the <sup>13</sup>C NMR spectra to characterize the regioselectivity of <b>M2</b> and <b>M4</b>, but <b>M3</b> showed 67% head-to-tail enchainment (see Section S2E for more details)”. In the Supporting Information, this section (Section S2E) on page S11 should now read “We therefore acquired a quantitative <sup>13</sup>C NMR spectrum using a 20 s relaxation delay (Figure S14D,E), which determined <b>P3</b> contains 67% HT and 33% HH+TT linkages as well as 86% <i>E</i>- and 14% <i>Z</i>-alkenes.” On page S12, this section should now read “An analogous analysis was performed for <b>P2</b> ... and <b>P4</b> ... to determine the microstructure. While the regiochemistry of enchainment could not be determined due to insufficient resolution in the <sup>13</sup>C NMR spectra, <b>P2</b> was found to have 84% <i>E</i>-alkenes and <b>P4</b> to have 78% <i>E</i>-alkenes”. Figure S13. Band-selective HMBC (900 and 226 MHz, CDCl<sub>3</sub>) of <b>P3</b> with correlations highlighted with solid (<i>E</i>-alkenes) and dashed (<i>Z</i>-alkenes) lines. Correlations on the nitrogen (H) side are in blue, on the oxygen (T) side in red, and between sides in purple for the HT regioisomer. Figure S14. Partial <sup>13</sup>C NMR spectrum (151 MHz, CDCl<sub>3</sub>) of <b>P3</b> acquired with (A) 2 s, (B, D, E) 20 s, and (C) 30 s relaxation delays using the Bruker zgig30 pulse sequence and (A–C) 128 or (D, E) 1275 scans. The peaks in Part D were fit in MestReNova using a generalized Lorentzian peak shape with the integrals for the peaks at 130.02 and 129.97 ppm (used to quantify regiochemistry) given in Table S8. The deconvoluted peaks are shown in blue, the sum in pink, and the residuals in red. The peaks in Part E were integrated using the standard integration feature in MestReNova for the quantification of the alkene geometry. The corrected versions of Figures S13, S14, S19, and S25, along with the corrected captions for Figures S20 and S26 are presented here. New Table S8 tabulates the integrations of the deconvoluted quantitative <sup>13</sup>C NMR peaks for <b>P3</b>, and new Figure S49 shows unresolved alkene peaks for <b>P2</b> and <b>P4</b> in the <sup>13</sup>C NMR spectra using a 900 MHz instrument.<named-content content-type=\\\"anchor\\\" r type=\\\"simple\\\"></named-content><named-content content-type=\\\"anchor\\\" r type=\\\"simple\\\"></named-content><named-content content-type=\\\"anchor\\\" r type=\\\"simple\\\"></named-content><named-content content-type=\\\"anchor\\\" r type=\\\"simple\\\"></named-content><named-content content-type=\\\"anchor\\\" r type=\\\"simple\\\"></named-content><named-content content-type=\\\"anchor\\\" r type=\\\"simple\\\"></named-content><named-content content-type=\\\"anchor\\\" r type=\\\"simple\\\"></named-content> Figure S19. Band-selective HMBC spectrum (500 and 126 MHz, CDCl<sub>3</sub>) of <b>P2</b>. Figure S20. Partial <sup>13</sup>C NMR (151 MHz, CDCl<sub>3</sub>, 20 s relaxation delay) spectrum of olefin region of <b>P2</b> used to quantify the ratio of <i>E</i>- and <i>Z</i>-alkenes. Figure S25. Band-selective HMBC spectrum (500 and 126 MHz, CDCl<sub>3</sub>) of <b>P4</b>. Figure S26. Partial <sup>13</sup>C NMR (151 MHz, CDCl<sub>3</sub>, 60 s relaxation delay) spectrum of olefin region of <b>P4</b> used to quantify the ratio of <i>E</i>- and <i>Z</i>-alkenes. Determined in MestReNova from line fitting with a generalized Lorentzian peak shape. Normalized by the number of C atoms (i.e., 1 for HT or 2 for TT). Figure S49. Partial <sup>13</sup>C NMR spectra (226 MHz, CDCl<sub>3</sub>) of (A) <b>P2</b> and (B) <b>P4</b> showing the alkene peaks were unresolved even at a higher field. The higher field spectra were recorded on a Bruker 900 MHz Avance III instrument with a TCI cryoprobe [(<sup>1</sup>H, 900 MHz), (<sup>13</sup>C, 226 MHz)] at 22 °C. This article has not yet been cited by other publications.\",\"PeriodicalId\":18,\"journal\":{\"name\":\"ACS Macro Letters\",\"volume\":\"58 1\",\"pages\":\"\"},\"PeriodicalIF\":5.2000,\"publicationDate\":\"2025-05-29\",\"publicationTypes\":\"Journal Article\",\"fieldsOfStudy\":null,\"isOpenAccess\":false,\"openAccessPdf\":\"\",\"citationCount\":\"0\",\"resultStr\":null,\"platform\":\"Semanticscholar\",\"paperid\":null,\"PeriodicalName\":\"ACS Macro Letters\",\"FirstCategoryId\":\"92\",\"ListUrlMain\":\"https://doi.org/10.1021/acsmacrolett.5c00318\",\"RegionNum\":0,\"RegionCategory\":null,\"ArticlePicture\":[],\"TitleCN\":null,\"AbstractTextCN\":null,\"PMCID\":null,\"EPubDate\":\"\",\"PubModel\":\"\",\"JCR\":\"Q1\",\"JCRName\":\"POLYMER SCIENCE\",\"Score\":null,\"Total\":0}","platform":"Semanticscholar","paperid":null,"PeriodicalName":"ACS Macro Letters","FirstCategoryId":"92","ListUrlMain":"https://doi.org/10.1021/acsmacrolett.5c00318","RegionNum":0,"RegionCategory":null,"ArticlePicture":[],"TitleCN":null,"AbstractTextCN":null,"PMCID":null,"EPubDate":"","PubModel":"","JCR":"Q1","JCRName":"POLYMER SCIENCE","Score":null,"Total":0}
Correction to “Chemically Recyclable, High Molar Mass Polyoxazolidinones via Ring-Opening Metathesis Polymerization”
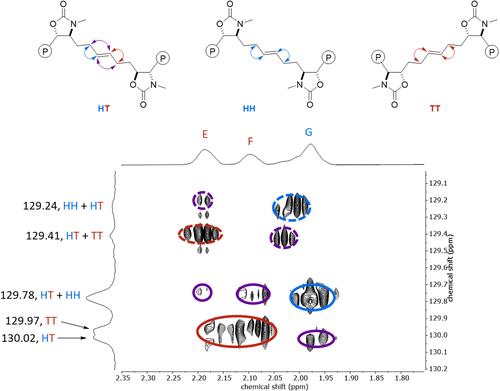
In our original publication, the 13C NMR spectra that were used for microstructure assignment and quantification lacked resolution of all eight signals that arise from a mixture of E- and Z-alkenes as well as head-to-tail (HT), head-to-head (HH), and tail-to-tail (TT) regioisomeric linkages. The signal-to-noise of the original band-selective HMBC NMR spectra showed HT cross peaks for the more prominent 13C NMR peaks and did not show these cross peaks for the lower intensity 13C NMR peaks, leading us to our original peak assignments. Subsequently acquired spectra for P3 detected two overlapping peaks at 130.02 and 129.97 ppm that were previously not resolved. A band-selective HMBC spectrum using a higher field instrument (900 vs 500 MHz in our original publication) indicated the microstructures in our original publication were assigned incorrectly from the lower resolution spectra. The major versus minor peaks in the 13C NMR spectra arise from differences in alkene geometry rather than from regiochemistry, as originally reported. The microstructure of P3 consists of 67% HT and 33% HH+TT linkages (quantified from the peaks at 130.02 and 129.97 ppm) as well as 86% E- and 14% Z-alkenes (assigned from the relative intensity of the peaks in the IR spectrum and quantified using all peaks). Newly acquired 13C NMR spectra of P2 and P4 unfortunately did not have an analogous increase in resolution, even when acquired on a 900 MHz instrument. While the lower resolution for these polymers prevents the assignment of regiochemistry, the alkene geometry has been corrected to 84% and 78% E-alkenes for P2 and P4, respectively. The overall conclusions of the work are not affected except for the microstructure analysis. In the main text, this section should now read: “Because these Oxa-fused COE monomers are unsymmetrical, we attempted to characterize the regioregularity of enchainment for M2–M4 using IR and NMR spectroscopies. There was insufficient resolution in the 13C NMR spectra to characterize the regioselectivity of M2 and M4, but M3 showed 67% head-to-tail enchainment (see Section S2E for more details)”. In the Supporting Information, this section (Section S2E) on page S11 should now read “We therefore acquired a quantitative 13C NMR spectrum using a 20 s relaxation delay (Figure S14D,E), which determined P3 contains 67% HT and 33% HH+TT linkages as well as 86% E- and 14% Z-alkenes.” On page S12, this section should now read “An analogous analysis was performed for P2 ... and P4 ... to determine the microstructure. While the regiochemistry of enchainment could not be determined due to insufficient resolution in the 13C NMR spectra, P2 was found to have 84% E-alkenes and P4 to have 78% E-alkenes”. Figure S13. Band-selective HMBC (900 and 226 MHz, CDCl3) of P3 with correlations highlighted with solid (E-alkenes) and dashed (Z-alkenes) lines. Correlations on the nitrogen (H) side are in blue, on the oxygen (T) side in red, and between sides in purple for the HT regioisomer. Figure S14. Partial 13C NMR spectrum (151 MHz, CDCl3) of P3 acquired with (A) 2 s, (B, D, E) 20 s, and (C) 30 s relaxation delays using the Bruker zgig30 pulse sequence and (A–C) 128 or (D, E) 1275 scans. The peaks in Part D were fit in MestReNova using a generalized Lorentzian peak shape with the integrals for the peaks at 130.02 and 129.97 ppm (used to quantify regiochemistry) given in Table S8. The deconvoluted peaks are shown in blue, the sum in pink, and the residuals in red. The peaks in Part E were integrated using the standard integration feature in MestReNova for the quantification of the alkene geometry. The corrected versions of Figures S13, S14, S19, and S25, along with the corrected captions for Figures S20 and S26 are presented here. New Table S8 tabulates the integrations of the deconvoluted quantitative 13C NMR peaks for P3, and new Figure S49 shows unresolved alkene peaks for P2 and P4 in the 13C NMR spectra using a 900 MHz instrument. Figure S19. Band-selective HMBC spectrum (500 and 126 MHz, CDCl3) of P2. Figure S20. Partial 13C NMR (151 MHz, CDCl3, 20 s relaxation delay) spectrum of olefin region of P2 used to quantify the ratio of E- and Z-alkenes. Figure S25. Band-selective HMBC spectrum (500 and 126 MHz, CDCl3) of P4. Figure S26. Partial 13C NMR (151 MHz, CDCl3, 60 s relaxation delay) spectrum of olefin region of P4 used to quantify the ratio of E- and Z-alkenes. Determined in MestReNova from line fitting with a generalized Lorentzian peak shape. Normalized by the number of C atoms (i.e., 1 for HT or 2 for TT). Figure S49. Partial 13C NMR spectra (226 MHz, CDCl3) of (A) P2 and (B) P4 showing the alkene peaks were unresolved even at a higher field. The higher field spectra were recorded on a Bruker 900 MHz Avance III instrument with a TCI cryoprobe [(1H, 900 MHz), (13C, 226 MHz)] at 22 °C. This article has not yet been cited by other publications.
期刊介绍:
ACS Macro Letters publishes research in all areas of contemporary soft matter science in which macromolecules play a key role, including nanotechnology, self-assembly, supramolecular chemistry, biomaterials, energy generation and storage, and renewable/sustainable materials. Submissions to ACS Macro Letters should justify clearly the rapid disclosure of the key elements of the study. The scope of the journal includes high-impact research of broad interest in all areas of polymer science and engineering, including cross-disciplinary research that interfaces with polymer science.
With the launch of ACS Macro Letters, all Communications that were formerly published in Macromolecules and Biomacromolecules will be published as Letters in ACS Macro Letters.
 求助内容:
求助内容: 应助结果提醒方式:


