Shravan Asthana, Daron Excel, Hemali Shah, Abhinav Talwar, Stephanie Smith
{"title":"私募股权拥有的耳鼻喉科诊所临床医生分布趋势。","authors":"Shravan Asthana, Daron Excel, Hemali Shah, Abhinav Talwar, Stephanie Smith","doi":"10.1002/oto2.70112","DOIUrl":null,"url":null,"abstract":"<p><strong>Objective: </strong>Investigate how private equity (PE) acquisitions shape the otolaryngology workforce.</p><p><strong>Study design: </strong>Cross-sectional.</p><p><strong>Setting: </strong>Private outpatient clinics.</p><p><strong>Methods: </strong>A comprehensive market database, Pitchbook (Seattle, WA), was queried utilizing keywords for outpatient otolaryngology practices acquired by PE firms from 2010 to 2023. Acquisitions were manually verified using practice websites. An open-source website archive service, WayBack Machine, was utilized to track workforce history of practicing otolaryngologist physicians, audiologists (AuDs), and advanced practice providers (APPs) at these outpatient practices and then subjected to linear regression and Pearson correlation test analysis.</p><p><strong>Results: </strong>In total, 25 otolaryngology practices were determined to have been acquired by PE, all between 2018 and 2023. Acquisitions predominantly occurred in 2020 (n = 8, 32%) and 2023 (n = 7, 28%) and were mostly in the South Atlantic (n = 10, 40%) or Midwest (n = 8, 32%) regions. From 2018 to 2023, total practice locations increased by 32.0% (n = 194 to n = 256), and the total clinician pool increased by 17.9% (n = 901 to n = 1007). Although physicians (n = 500 to n = 517, <i>r</i> = 0.59, <i>P</i> = .213) and AuDs (n = 229 to n = 242, <i>r</i> = 0.34, <i>P</i> = .507) increased nonlinearly, the increase in APPs was strongly linear (n = 172 to n = 248, <i>r</i> = 0.95, <i>P</i> = .003). As a proportion of the total clinician pool, there was a relative decrease in physicians (55.5%-51.3%) and AuDs (25.4%-24.0%), offset by a relative increase in APPs (19.1%-24.6%).</p><p><strong>Conclusion: </strong>Our findings indicate a disproportionate increase in APPs relative to physicians and AuDs, although without a comparison group we are unable to draw conclusions in relation to changes in the non-PE workforce as a whole.</p>","PeriodicalId":19697,"journal":{"name":"OTO Open","volume":"9 2","pages":"e70112"},"PeriodicalIF":1.8000,"publicationDate":"2025-04-11","publicationTypes":"Journal Article","fieldsOfStudy":null,"isOpenAccess":false,"openAccessPdf":"https://www.ncbi.nlm.nih.gov/pmc/articles/PMC11986684/pdf/","citationCount":"0","resultStr":"{\"title\":\"Trends in Private Equity Owned Otolaryngology Practice Clinician Distribution.\",\"authors\":\"Shravan Asthana, Daron Excel, Hemali Shah, Abhinav Talwar, Stephanie Smith\",\"doi\":\"10.1002/oto2.70112\",\"DOIUrl\":null,\"url\":null,\"abstract\":\"<p><strong>Objective: </strong>Investigate how private equity (PE) acquisitions shape the otolaryngology workforce.</p><p><strong>Study design: </strong>Cross-sectional.</p><p><strong>Setting: </strong>Private outpatient clinics.</p><p><strong>Methods: </strong>A comprehensive market database, Pitchbook (Seattle, WA), was queried utilizing keywords for outpatient otolaryngology practices acquired by PE firms from 2010 to 2023. Acquisitions were manually verified using practice websites. An open-source website archive service, WayBack Machine, was utilized to track workforce history of practicing otolaryngologist physicians, audiologists (AuDs), and advanced practice providers (APPs) at these outpatient practices and then subjected to linear regression and Pearson correlation test analysis.</p><p><strong>Results: </strong>In total, 25 otolaryngology practices were determined to have been acquired by PE, all between 2018 and 2023. Acquisitions predominantly occurred in 2020 (n = 8, 32%) and 2023 (n = 7, 28%) and were mostly in the South Atlantic (n = 10, 40%) or Midwest (n = 8, 32%) regions. From 2018 to 2023, total practice locations increased by 32.0% (n = 194 to n = 256), and the total clinician pool increased by 17.9% (n = 901 to n = 1007). Although physicians (n = 500 to n = 517, <i>r</i> = 0.59, <i>P</i> = .213) and AuDs (n = 229 to n = 242, <i>r</i> = 0.34, <i>P</i> = .507) increased nonlinearly, the increase in APPs was strongly linear (n = 172 to n = 248, <i>r</i> = 0.95, <i>P</i> = .003). As a proportion of the total clinician pool, there was a relative decrease in physicians (55.5%-51.3%) and AuDs (25.4%-24.0%), offset by a relative increase in APPs (19.1%-24.6%).</p><p><strong>Conclusion: </strong>Our findings indicate a disproportionate increase in APPs relative to physicians and AuDs, although without a comparison group we are unable to draw conclusions in relation to changes in the non-PE workforce as a whole.</p>\",\"PeriodicalId\":19697,\"journal\":{\"name\":\"OTO Open\",\"volume\":\"9 2\",\"pages\":\"e70112\"},\"PeriodicalIF\":1.8000,\"publicationDate\":\"2025-04-11\",\"publicationTypes\":\"Journal Article\",\"fieldsOfStudy\":null,\"isOpenAccess\":false,\"openAccessPdf\":\"https://www.ncbi.nlm.nih.gov/pmc/articles/PMC11986684/pdf/\",\"citationCount\":\"0\",\"resultStr\":null,\"platform\":\"Semanticscholar\",\"paperid\":null,\"PeriodicalName\":\"OTO Open\",\"FirstCategoryId\":\"1085\",\"ListUrlMain\":\"https://doi.org/10.1002/oto2.70112\",\"RegionNum\":0,\"RegionCategory\":null,\"ArticlePicture\":[],\"TitleCN\":null,\"AbstractTextCN\":null,\"PMCID\":null,\"EPubDate\":\"2025/4/1 0:00:00\",\"PubModel\":\"eCollection\",\"JCR\":\"Q2\",\"JCRName\":\"OTORHINOLARYNGOLOGY\",\"Score\":null,\"Total\":0}","platform":"Semanticscholar","paperid":null,"PeriodicalName":"OTO Open","FirstCategoryId":"1085","ListUrlMain":"https://doi.org/10.1002/oto2.70112","RegionNum":0,"RegionCategory":null,"ArticlePicture":[],"TitleCN":null,"AbstractTextCN":null,"PMCID":null,"EPubDate":"2025/4/1 0:00:00","PubModel":"eCollection","JCR":"Q2","JCRName":"OTORHINOLARYNGOLOGY","Score":null,"Total":0}
引用次数: 0
摘要
目的:探讨私募股权(PE)收购如何塑造耳鼻喉科的劳动力。研究设计:横断面。环境:私人门诊诊所。方法:利用2010年至2023年PE公司收购的门诊耳鼻喉科业务关键词,对综合市场数据库Pitchbook (Seattle, WA)进行查询。使用实践网站手动验证收购。利用开源网站存档服务WayBack Machine跟踪门诊执业耳鼻喉科医师、听力学家(AuDs)和高级执业医师(app)的劳动力历史,然后进行线性回归和Pearson相关检验分析。结果:共有25个耳鼻喉科实践被PE确定为已获得,均在2018年至2023年之间。收购主要发生在2020年(n = 8, 32%)和2023年(n = 7, 28%),主要发生在南大西洋(n = 10, 40%)或中西部(n = 8, 32%)地区。从2018年到2023年,总执业地点增加了32.0% (n = 194 ~ n = 256),临床医生总数增加了17.9% (n = 901 ~ n = 1007)。虽然医生(n = 500 ~ n = 517, r = 0.59, P = .213)和AuDs (n = 229 ~ n = 242, r = 0.34, P = .507)呈非线性增加,但app的增加呈强线性增加(n = 172 ~ n = 248, r = 0.95, P = .003)。作为临床医生总数的一部分,医生(55.5%-51.3%)和aud(25.4%-24.0%)相对减少,被app的相对增加(19.1%-24.6%)所抵消。结论:我们的研究结果表明,相对于医生和aud, app的增加不成比例,尽管没有比较组,我们无法得出非pe劳动力整体变化的结论。
Trends in Private Equity Owned Otolaryngology Practice Clinician Distribution.
Objective: Investigate how private equity (PE) acquisitions shape the otolaryngology workforce.
Study design: Cross-sectional.
Setting: Private outpatient clinics.
Methods: A comprehensive market database, Pitchbook (Seattle, WA), was queried utilizing keywords for outpatient otolaryngology practices acquired by PE firms from 2010 to 2023. Acquisitions were manually verified using practice websites. An open-source website archive service, WayBack Machine, was utilized to track workforce history of practicing otolaryngologist physicians, audiologists (AuDs), and advanced practice providers (APPs) at these outpatient practices and then subjected to linear regression and Pearson correlation test analysis.
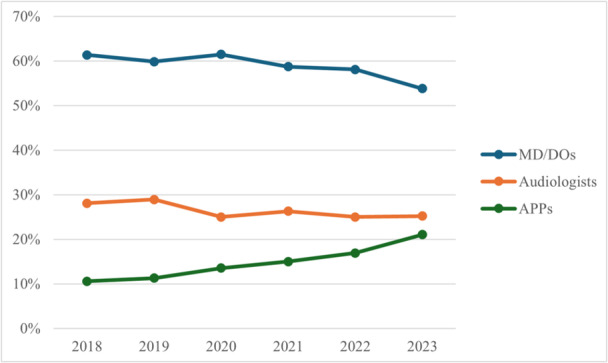
Results: In total, 25 otolaryngology practices were determined to have been acquired by PE, all between 2018 and 2023. Acquisitions predominantly occurred in 2020 (n = 8, 32%) and 2023 (n = 7, 28%) and were mostly in the South Atlantic (n = 10, 40%) or Midwest (n = 8, 32%) regions. From 2018 to 2023, total practice locations increased by 32.0% (n = 194 to n = 256), and the total clinician pool increased by 17.9% (n = 901 to n = 1007). Although physicians (n = 500 to n = 517, r = 0.59, P = .213) and AuDs (n = 229 to n = 242, r = 0.34, P = .507) increased nonlinearly, the increase in APPs was strongly linear (n = 172 to n = 248, r = 0.95, P = .003). As a proportion of the total clinician pool, there was a relative decrease in physicians (55.5%-51.3%) and AuDs (25.4%-24.0%), offset by a relative increase in APPs (19.1%-24.6%).
Conclusion: Our findings indicate a disproportionate increase in APPs relative to physicians and AuDs, although without a comparison group we are unable to draw conclusions in relation to changes in the non-PE workforce as a whole.

 求助内容:
求助内容: 应助结果提醒方式:


