授权社区:为不同任务和用户量身定制的流行病数据可视化。
IF 1.4
4区 计算机科学
Q3 COMPUTER SCIENCE, SOFTWARE ENGINEERING
引用次数: 0
摘要
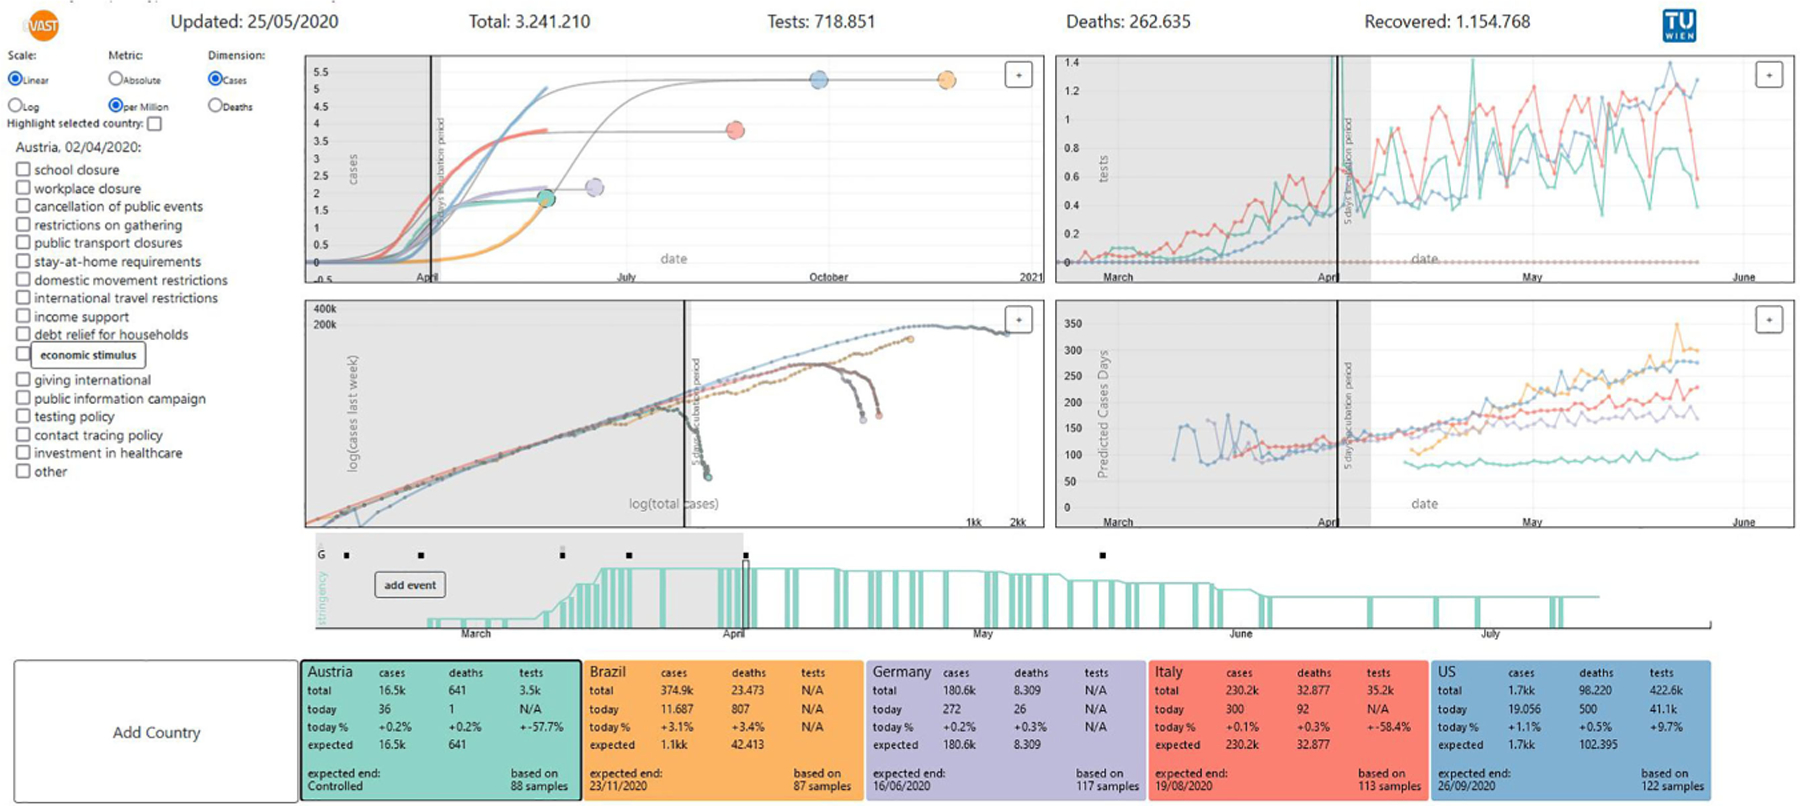
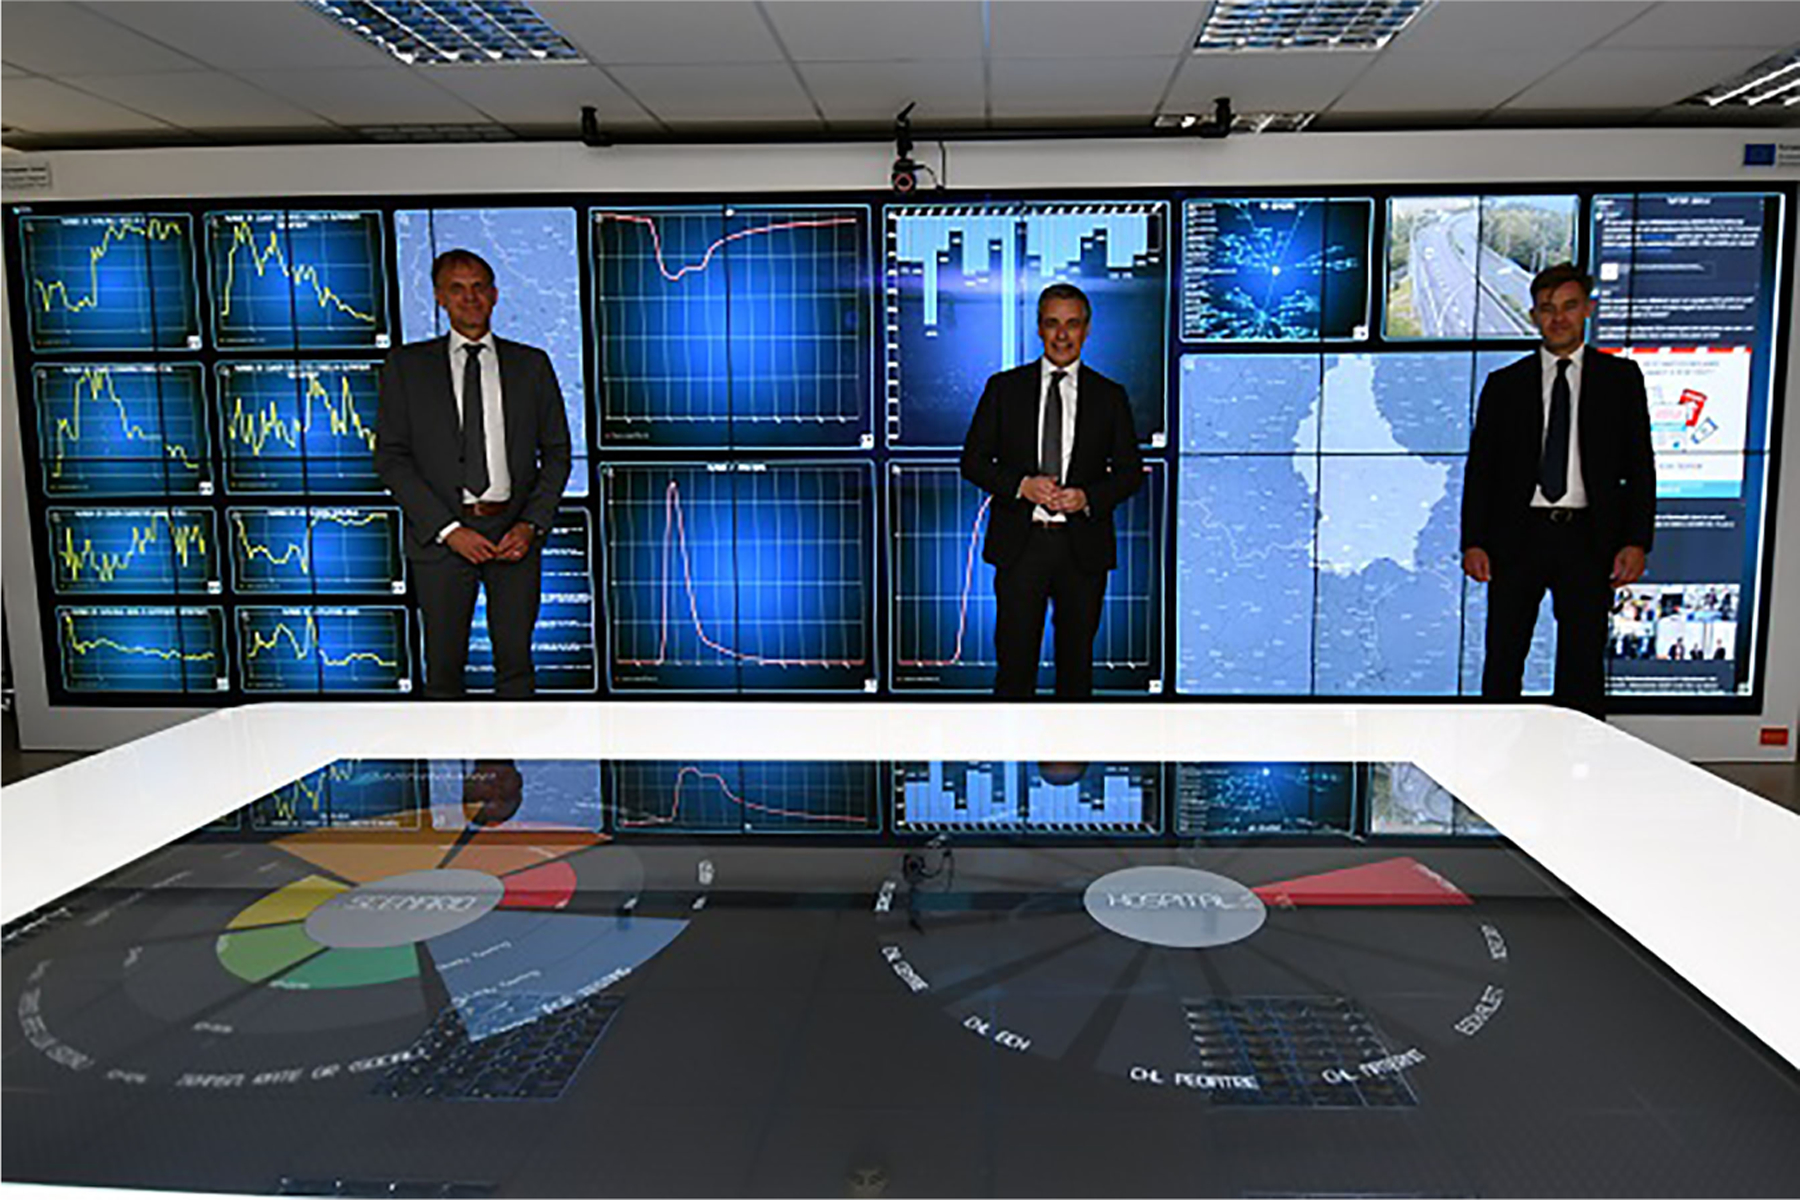
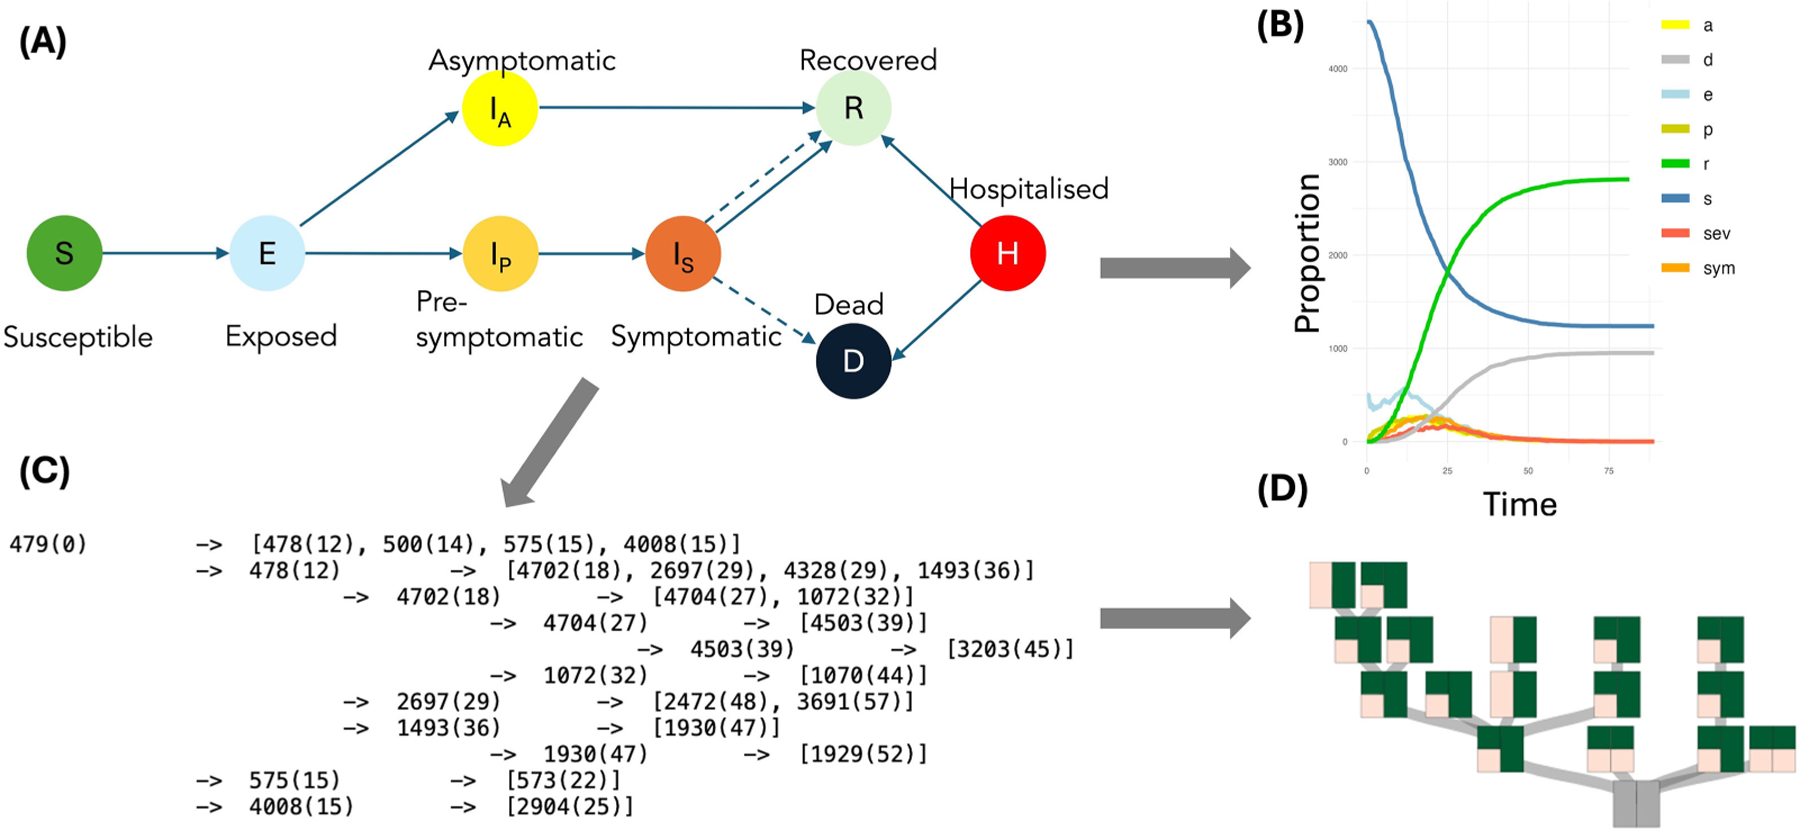
在2019冠状病毒病大流行期间,大量利用了数据可视化方法。我们回顾了我们在一系列跨学科COVID-19大流行项目中的设计经验。我们描述了我们在这些项目中遇到的挑战,描述了各自的用户群体,我们支持的目标和任务,以及我们使用的数据类型和视觉媒体。此外,我们在一系列案例研究中实例化了这些特征。最后,我们描述了考虑到未来流行病的视觉分析经验教训。本文章由计算机程序翻译,如有差异,请以英文原文为准。
Empowering Communities: Tailored Pandemic Data Visualization for Varied Tasks and Users.
Data visualization methodologies were intensively leveraged during the COVID-19 pandemic. We review our design experience working on a set of interdisciplinary COVID-19 pandemic projects. We describe the challenges we met in these projects, characterize the respective user communities, the goals and tasks we supported, and the data types and visual media we worked with. Furthermore, we instantiate these characterizations in a series of case studies. Finally, we describe the visual analysis lessons we learned, considering future pandemics.
求助全文
通过发布文献求助,成功后即可免费获取论文全文。
去求助
来源期刊

IEEE Computer Graphics and Applications
工程技术-计算机:软件工程
CiteScore
3.20
自引率
5.60%
发文量
160
审稿时长
>12 weeks
期刊介绍:
IEEE Computer Graphics and Applications (CG&A) bridges the theory and practice of computer graphics, visualization, virtual and augmented reality, and HCI. From specific algorithms to full system implementations, CG&A offers a unique combination of peer-reviewed feature articles and informal departments. Theme issues guest edited by leading researchers in their fields track the latest developments and trends in computer-generated graphical content, while tutorials and surveys provide a broad overview of interesting and timely topics. Regular departments further explore the core areas of graphics as well as extend into topics such as usability, education, history, and opinion. Each issue, the story of our cover focuses on creative applications of the technology by an artist or designer. Published six times a year, CG&A is indispensable reading for people working at the leading edge of computer-generated graphics technology and its applications in everything from business to the arts.
 求助内容:
求助内容: 应助结果提醒方式:


