Feng Hu, Yuancheng Li, Hongfei Zeng, Renhua Ju, Di Jiang, Leida Zhang, Jun Li, Xingchao Liu, Guangyi Liu, Chengcheng Zhang
{"title":"基于机器学习的肝移植术后不同时期胆道并发症预测模型的开发和验证:一项多中心研究。","authors":"Feng Hu, Yuancheng Li, Hongfei Zeng, Renhua Ju, Di Jiang, Leida Zhang, Jun Li, Xingchao Liu, Guangyi Liu, Chengcheng Zhang","doi":"10.14309/ctg.0000000000000843","DOIUrl":null,"url":null,"abstract":"<p><strong>Introduction: </strong>The risk factors of biliary complications (BCs) after liver transplantation are not comprehensively determined. BCs also vary in times of onset. Machine learning (ML) can reveal regularities based on large-scale data to make predictions and have demonstrated good performance in liver transplantation. However, whether ML can be an efficient tool for BC prediction was not determined.</p><p><strong>Methods: </strong>Five hundred seventeen patients from 2 centers were enrolled. Patients were randomly divided into training and validation sets at 3:1 ratio. K-fold cross-validation and the synthetic minority oversampling technique were used to debug the models, which were evaluated by receiver operating characteristic curves. SHapley Additive exPlanation values and Sankey diagrams were applied to visualize the results. Seven ML algorithms were administrated to build models for BCs prediction at 3, 6, and 12 months.</p><p><strong>Results: </strong>Among all the models, support vector machine produced the highest area under curve values in predicting BCs (3-month = 0.916; 6-month = 0.892; 12-month = 0.885). According to the analysis of support vector machine, the 3-month risk factors of BCs and corresponding SHapley Additive exPlanation value ranges were donor age (-0.13, 0.21), Model for End-Stage Liver Disease score (-0.15, 0.18), neoplastic disease (-0.14, 0.28), diabetes (-0.12, 0.27), hypertension (-0.13, 0.21), and intraoperative blood transfusion (-0.09, 0.25), whereas 6-month factors were recipient age (-0.14, 0.16), donor body mass index (-0.10, 0.13), recipient body mass index (-0.13, 0.23), and diabetes (-0.12, 0.43). The 12-month risk factors were recipient age (-0.14, 0.19), diabetes (-0.13, 0.25), and basiliximab (-0.16, 0.24). The Sankey diagram enabled clear visualization of the contribution of individual risk factors to the model in different times of BCs onset.</p><p><strong>Discussion: </strong>The ML algorithm was able to identify risk factors of BCs in all postoperative periods and this supplied insights in patient management.</p>","PeriodicalId":10278,"journal":{"name":"Clinical and Translational Gastroenterology","volume":" ","pages":"e00843"},"PeriodicalIF":3.0000,"publicationDate":"2025-04-18","publicationTypes":"Journal Article","fieldsOfStudy":null,"isOpenAccess":false,"openAccessPdf":"https://www.ncbi.nlm.nih.gov/pmc/articles/PMC12180812/pdf/","citationCount":"0","resultStr":"{\"title\":\"Machine Learning Model for Predicting Biliary Complications After Liver Transplantation.\",\"authors\":\"Feng Hu, Yuancheng Li, Hongfei Zeng, Renhua Ju, Di Jiang, Leida Zhang, Jun Li, Xingchao Liu, Guangyi Liu, Chengcheng Zhang\",\"doi\":\"10.14309/ctg.0000000000000843\",\"DOIUrl\":null,\"url\":null,\"abstract\":\"<p><strong>Introduction: </strong>The risk factors of biliary complications (BCs) after liver transplantation are not comprehensively determined. BCs also vary in times of onset. Machine learning (ML) can reveal regularities based on large-scale data to make predictions and have demonstrated good performance in liver transplantation. However, whether ML can be an efficient tool for BC prediction was not determined.</p><p><strong>Methods: </strong>Five hundred seventeen patients from 2 centers were enrolled. Patients were randomly divided into training and validation sets at 3:1 ratio. K-fold cross-validation and the synthetic minority oversampling technique were used to debug the models, which were evaluated by receiver operating characteristic curves. SHapley Additive exPlanation values and Sankey diagrams were applied to visualize the results. Seven ML algorithms were administrated to build models for BCs prediction at 3, 6, and 12 months.</p><p><strong>Results: </strong>Among all the models, support vector machine produced the highest area under curve values in predicting BCs (3-month = 0.916; 6-month = 0.892; 12-month = 0.885). According to the analysis of support vector machine, the 3-month risk factors of BCs and corresponding SHapley Additive exPlanation value ranges were donor age (-0.13, 0.21), Model for End-Stage Liver Disease score (-0.15, 0.18), neoplastic disease (-0.14, 0.28), diabetes (-0.12, 0.27), hypertension (-0.13, 0.21), and intraoperative blood transfusion (-0.09, 0.25), whereas 6-month factors were recipient age (-0.14, 0.16), donor body mass index (-0.10, 0.13), recipient body mass index (-0.13, 0.23), and diabetes (-0.12, 0.43). The 12-month risk factors were recipient age (-0.14, 0.19), diabetes (-0.13, 0.25), and basiliximab (-0.16, 0.24). The Sankey diagram enabled clear visualization of the contribution of individual risk factors to the model in different times of BCs onset.</p><p><strong>Discussion: </strong>The ML algorithm was able to identify risk factors of BCs in all postoperative periods and this supplied insights in patient management.</p>\",\"PeriodicalId\":10278,\"journal\":{\"name\":\"Clinical and Translational Gastroenterology\",\"volume\":\" \",\"pages\":\"e00843\"},\"PeriodicalIF\":3.0000,\"publicationDate\":\"2025-04-18\",\"publicationTypes\":\"Journal Article\",\"fieldsOfStudy\":null,\"isOpenAccess\":false,\"openAccessPdf\":\"https://www.ncbi.nlm.nih.gov/pmc/articles/PMC12180812/pdf/\",\"citationCount\":\"0\",\"resultStr\":null,\"platform\":\"Semanticscholar\",\"paperid\":null,\"PeriodicalName\":\"Clinical and Translational Gastroenterology\",\"FirstCategoryId\":\"3\",\"ListUrlMain\":\"https://doi.org/10.14309/ctg.0000000000000843\",\"RegionNum\":3,\"RegionCategory\":\"医学\",\"ArticlePicture\":[],\"TitleCN\":null,\"AbstractTextCN\":null,\"PMCID\":null,\"EPubDate\":\"2025/6/1 0:00:00\",\"PubModel\":\"eCollection\",\"JCR\":\"Q2\",\"JCRName\":\"GASTROENTEROLOGY & HEPATOLOGY\",\"Score\":null,\"Total\":0}","platform":"Semanticscholar","paperid":null,"PeriodicalName":"Clinical and Translational Gastroenterology","FirstCategoryId":"3","ListUrlMain":"https://doi.org/10.14309/ctg.0000000000000843","RegionNum":3,"RegionCategory":"医学","ArticlePicture":[],"TitleCN":null,"AbstractTextCN":null,"PMCID":null,"EPubDate":"2025/6/1 0:00:00","PubModel":"eCollection","JCR":"Q2","JCRName":"GASTROENTEROLOGY & HEPATOLOGY","Score":null,"Total":0}
Machine Learning Model for Predicting Biliary Complications After Liver Transplantation.
Introduction: The risk factors of biliary complications (BCs) after liver transplantation are not comprehensively determined. BCs also vary in times of onset. Machine learning (ML) can reveal regularities based on large-scale data to make predictions and have demonstrated good performance in liver transplantation. However, whether ML can be an efficient tool for BC prediction was not determined.
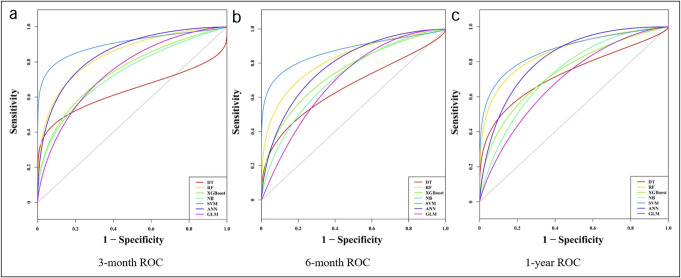
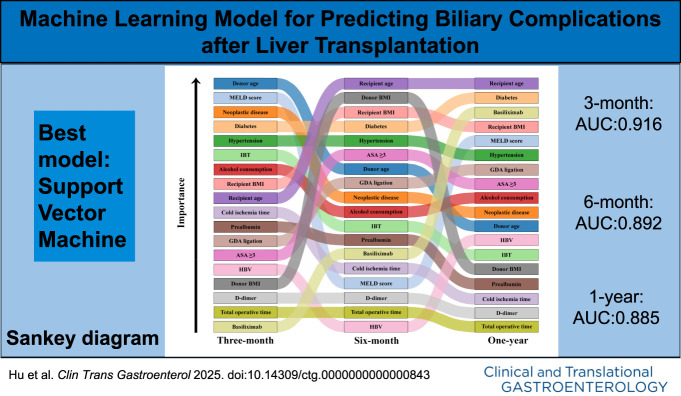
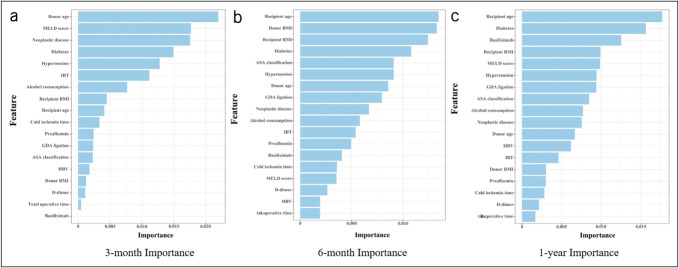
Methods: Five hundred seventeen patients from 2 centers were enrolled. Patients were randomly divided into training and validation sets at 3:1 ratio. K-fold cross-validation and the synthetic minority oversampling technique were used to debug the models, which were evaluated by receiver operating characteristic curves. SHapley Additive exPlanation values and Sankey diagrams were applied to visualize the results. Seven ML algorithms were administrated to build models for BCs prediction at 3, 6, and 12 months.
Results: Among all the models, support vector machine produced the highest area under curve values in predicting BCs (3-month = 0.916; 6-month = 0.892; 12-month = 0.885). According to the analysis of support vector machine, the 3-month risk factors of BCs and corresponding SHapley Additive exPlanation value ranges were donor age (-0.13, 0.21), Model for End-Stage Liver Disease score (-0.15, 0.18), neoplastic disease (-0.14, 0.28), diabetes (-0.12, 0.27), hypertension (-0.13, 0.21), and intraoperative blood transfusion (-0.09, 0.25), whereas 6-month factors were recipient age (-0.14, 0.16), donor body mass index (-0.10, 0.13), recipient body mass index (-0.13, 0.23), and diabetes (-0.12, 0.43). The 12-month risk factors were recipient age (-0.14, 0.19), diabetes (-0.13, 0.25), and basiliximab (-0.16, 0.24). The Sankey diagram enabled clear visualization of the contribution of individual risk factors to the model in different times of BCs onset.
Discussion: The ML algorithm was able to identify risk factors of BCs in all postoperative periods and this supplied insights in patient management.
期刊介绍:
Clinical and Translational Gastroenterology (CTG), published on behalf of the American College of Gastroenterology (ACG), is a peer-reviewed open access online journal dedicated to innovative clinical work in the field of gastroenterology and hepatology. CTG hopes to fulfill an unmet need for clinicians and scientists by welcoming novel cohort studies, early-phase clinical trials, qualitative and quantitative epidemiologic research, hypothesis-generating research, studies of novel mechanisms and methodologies including public health interventions, and integration of approaches across organs and disciplines. CTG also welcomes hypothesis-generating small studies, methods papers, and translational research with clear applications to human physiology or disease.
Colon and small bowel
Endoscopy and novel diagnostics
Esophagus
Functional GI disorders
Immunology of the GI tract
Microbiology of the GI tract
Inflammatory bowel disease
Pancreas and biliary tract
Liver
Pathology
Pediatrics
Preventative medicine
Nutrition/obesity
Stomach.
 求助内容:
求助内容: 应助结果提醒方式:


