{"title":"两种淀粉样PET标度方法:centiloid scale和amyloid-β load的比较及截止值。","authors":"Ryo Yamakuni, Mitsunari Abe, Naoyuki Ukon, Hiroshi Matsuda, Harumasa Takano, Nobukatsu Sawamoto, Atsushi Shima, Yuhei Mori, Hirofumi Sekino, Shiro Ishii, Kenji Fukushima, Toshiki Mizuno, Jin Narumoto, Takashi Hanakawa, Hiroshi Ito, Parkinson’s and Alzheimer’s disease Dimensional Neuroimaging Initiative (PADNI)","doi":"10.1007/s12149-025-02051-6","DOIUrl":null,"url":null,"abstract":"<div><h3>Objective</h3><p>To enhance amyloid-β (Aβ) positron emission tomography (PET) diagnostic accuracy and adjust for tracer differences, the amyloid-β load (Aβ<sub>L</sub>) and centiloid (CL) scale were developed. However, the correlation and superiority of these indicators remain unclear. This study aimed to elucidate the correlation and determine cutoff values.</p><h3>Methods</h3><p>Data from 281 consecutive participants (144 males; mean age, 69.6 years) in the Parkinson’s and Alzheimer’s Disease Dimensional Neuroimaging Initiative study were analyzed. Initial data, including Aβ PET, structural MRI, and Global Clinical Dementia Rating (G-CDR) scores, were reviewed. CL was calculated using the cerebral cortical and striatum Volume of Interest templates (VOI) and whole cerebellum VOI. Aβ<sub>L</sub> was calculated using voxel-wise regression with two canonical images representing non-displaceable and specific binding. Visual estimation was performed by five radiologists, with two independently classify as visual-only Aβ-negative or Aβ-positive. The discrepancies were resolved through majority consensus involving a third observer. Additional visual estimation was performed for cases with CL value under 10 but visual-only Aβ-positive, and those over 30 but Aβ-negative, by two nuclear medicine radiologists. The discrepancies were resolved through discussion and classify as final Aβ diagnosis negative or positive.</p><h3>Results</h3><p>CL and Aβ<sub>L</sub> correlated linearly (CL = Aβ<sub>L</sub> × 2.10–9.40, <i>R</i><sup>2</sup> = 0.923). In predicting final Aβ diagnosis negative versus positive, both CL (AUC = 0.996) and Aβ<sub>L</sub> (AUC = 0.997) were significant, with no significant differences (<i>P</i> = 0.882). The Youden Index was 23.3 for CL and 15.6 for Aβ<sub>L</sub>. In predicting cognitively normal participants (G-CDR = 0) from others, both CL (AUC = 0.687) and Aβ<sub>L</sub> (AUC = 0.667) were significant, with no significant differences (<i>P</i> = 0.379). The Youden Index was 11.9 for CL and 11.6 for Aβ<sub>L</sub>. Using a non-biased Gaussian mixture model, the normal group’s mean and SD were −2.5 (SD = 6.5) for CL and 3.7 (SD = 3.0) for Aβ<sub>L</sub>, resulting in 95% limits (mean + 2SD) of 10.4 for CL and 9.7 for Aβ<sub>L</sub>.</p><h3>Conclusions</h3><p>This study demonstrated a high correlation and non-inferiority between CL and Aβ<sub>L</sub>.</p></div>","PeriodicalId":8007,"journal":{"name":"Annals of Nuclear Medicine","volume":"39 8","pages":"799 - 812"},"PeriodicalIF":2.5000,"publicationDate":"2025-04-26","publicationTypes":"Journal Article","fieldsOfStudy":null,"isOpenAccess":false,"openAccessPdf":"","citationCount":"0","resultStr":"{\"title\":\"Comparison and cutoff values of two amyloid PET scaling methods: centiloid scale and amyloid-β load\",\"authors\":\"Ryo Yamakuni, Mitsunari Abe, Naoyuki Ukon, Hiroshi Matsuda, Harumasa Takano, Nobukatsu Sawamoto, Atsushi Shima, Yuhei Mori, Hirofumi Sekino, Shiro Ishii, Kenji Fukushima, Toshiki Mizuno, Jin Narumoto, Takashi Hanakawa, Hiroshi Ito, Parkinson’s and Alzheimer’s disease Dimensional Neuroimaging Initiative (PADNI)\",\"doi\":\"10.1007/s12149-025-02051-6\",\"DOIUrl\":null,\"url\":null,\"abstract\":\"<div><h3>Objective</h3><p>To enhance amyloid-β (Aβ) positron emission tomography (PET) diagnostic accuracy and adjust for tracer differences, the amyloid-β load (Aβ<sub>L</sub>) and centiloid (CL) scale were developed. However, the correlation and superiority of these indicators remain unclear. This study aimed to elucidate the correlation and determine cutoff values.</p><h3>Methods</h3><p>Data from 281 consecutive participants (144 males; mean age, 69.6 years) in the Parkinson’s and Alzheimer’s Disease Dimensional Neuroimaging Initiative study were analyzed. Initial data, including Aβ PET, structural MRI, and Global Clinical Dementia Rating (G-CDR) scores, were reviewed. CL was calculated using the cerebral cortical and striatum Volume of Interest templates (VOI) and whole cerebellum VOI. Aβ<sub>L</sub> was calculated using voxel-wise regression with two canonical images representing non-displaceable and specific binding. Visual estimation was performed by five radiologists, with two independently classify as visual-only Aβ-negative or Aβ-positive. The discrepancies were resolved through majority consensus involving a third observer. Additional visual estimation was performed for cases with CL value under 10 but visual-only Aβ-positive, and those over 30 but Aβ-negative, by two nuclear medicine radiologists. The discrepancies were resolved through discussion and classify as final Aβ diagnosis negative or positive.</p><h3>Results</h3><p>CL and Aβ<sub>L</sub> correlated linearly (CL = Aβ<sub>L</sub> × 2.10–9.40, <i>R</i><sup>2</sup> = 0.923). In predicting final Aβ diagnosis negative versus positive, both CL (AUC = 0.996) and Aβ<sub>L</sub> (AUC = 0.997) were significant, with no significant differences (<i>P</i> = 0.882). The Youden Index was 23.3 for CL and 15.6 for Aβ<sub>L</sub>. In predicting cognitively normal participants (G-CDR = 0) from others, both CL (AUC = 0.687) and Aβ<sub>L</sub> (AUC = 0.667) were significant, with no significant differences (<i>P</i> = 0.379). The Youden Index was 11.9 for CL and 11.6 for Aβ<sub>L</sub>. Using a non-biased Gaussian mixture model, the normal group’s mean and SD were −2.5 (SD = 6.5) for CL and 3.7 (SD = 3.0) for Aβ<sub>L</sub>, resulting in 95% limits (mean + 2SD) of 10.4 for CL and 9.7 for Aβ<sub>L</sub>.</p><h3>Conclusions</h3><p>This study demonstrated a high correlation and non-inferiority between CL and Aβ<sub>L</sub>.</p></div>\",\"PeriodicalId\":8007,\"journal\":{\"name\":\"Annals of Nuclear Medicine\",\"volume\":\"39 8\",\"pages\":\"799 - 812\"},\"PeriodicalIF\":2.5000,\"publicationDate\":\"2025-04-26\",\"publicationTypes\":\"Journal Article\",\"fieldsOfStudy\":null,\"isOpenAccess\":false,\"openAccessPdf\":\"\",\"citationCount\":\"0\",\"resultStr\":null,\"platform\":\"Semanticscholar\",\"paperid\":null,\"PeriodicalName\":\"Annals of Nuclear Medicine\",\"FirstCategoryId\":\"3\",\"ListUrlMain\":\"https://link.springer.com/article/10.1007/s12149-025-02051-6\",\"RegionNum\":4,\"RegionCategory\":\"医学\",\"ArticlePicture\":[],\"TitleCN\":null,\"AbstractTextCN\":null,\"PMCID\":null,\"EPubDate\":\"\",\"PubModel\":\"\",\"JCR\":\"Q2\",\"JCRName\":\"RADIOLOGY, NUCLEAR MEDICINE & MEDICAL IMAGING\",\"Score\":null,\"Total\":0}","platform":"Semanticscholar","paperid":null,"PeriodicalName":"Annals of Nuclear Medicine","FirstCategoryId":"3","ListUrlMain":"https://link.springer.com/article/10.1007/s12149-025-02051-6","RegionNum":4,"RegionCategory":"医学","ArticlePicture":[],"TitleCN":null,"AbstractTextCN":null,"PMCID":null,"EPubDate":"","PubModel":"","JCR":"Q2","JCRName":"RADIOLOGY, NUCLEAR MEDICINE & MEDICAL IMAGING","Score":null,"Total":0}
Comparison and cutoff values of two amyloid PET scaling methods: centiloid scale and amyloid-β load
Objective
To enhance amyloid-β (Aβ) positron emission tomography (PET) diagnostic accuracy and adjust for tracer differences, the amyloid-β load (AβL) and centiloid (CL) scale were developed. However, the correlation and superiority of these indicators remain unclear. This study aimed to elucidate the correlation and determine cutoff values.
Methods
Data from 281 consecutive participants (144 males; mean age, 69.6 years) in the Parkinson’s and Alzheimer’s Disease Dimensional Neuroimaging Initiative study were analyzed. Initial data, including Aβ PET, structural MRI, and Global Clinical Dementia Rating (G-CDR) scores, were reviewed. CL was calculated using the cerebral cortical and striatum Volume of Interest templates (VOI) and whole cerebellum VOI. AβL was calculated using voxel-wise regression with two canonical images representing non-displaceable and specific binding. Visual estimation was performed by five radiologists, with two independently classify as visual-only Aβ-negative or Aβ-positive. The discrepancies were resolved through majority consensus involving a third observer. Additional visual estimation was performed for cases with CL value under 10 but visual-only Aβ-positive, and those over 30 but Aβ-negative, by two nuclear medicine radiologists. The discrepancies were resolved through discussion and classify as final Aβ diagnosis negative or positive.
Results
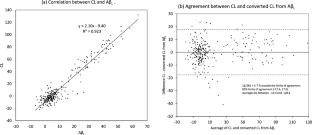
CL and AβL correlated linearly (CL = AβL × 2.10–9.40, R2 = 0.923). In predicting final Aβ diagnosis negative versus positive, both CL (AUC = 0.996) and AβL (AUC = 0.997) were significant, with no significant differences (P = 0.882). The Youden Index was 23.3 for CL and 15.6 for AβL. In predicting cognitively normal participants (G-CDR = 0) from others, both CL (AUC = 0.687) and AβL (AUC = 0.667) were significant, with no significant differences (P = 0.379). The Youden Index was 11.9 for CL and 11.6 for AβL. Using a non-biased Gaussian mixture model, the normal group’s mean and SD were −2.5 (SD = 6.5) for CL and 3.7 (SD = 3.0) for AβL, resulting in 95% limits (mean + 2SD) of 10.4 for CL and 9.7 for AβL.
Conclusions
This study demonstrated a high correlation and non-inferiority between CL and AβL.
期刊介绍:
Annals of Nuclear Medicine is an official journal of the Japanese Society of Nuclear Medicine. It develops the appropriate application of radioactive substances and stable nuclides in the field of medicine.
The journal promotes the exchange of ideas and information and research in nuclear medicine and includes the medical application of radionuclides and related subjects. It presents original articles, short communications, reviews and letters to the editor.
 求助内容:
求助内容: 应助结果提醒方式:


