Nadia Bouzid, Bruno Tassin, Johnny Gasperi and Rachid Dris
{"title":"微ftir成像光谱与热解-气相色谱/质谱相结合的微塑料定量方法。应用于河流沉积物†","authors":"Nadia Bouzid, Bruno Tassin, Johnny Gasperi and Rachid Dris","doi":"10.1039/D5AY00237K","DOIUrl":null,"url":null,"abstract":"<p >Several studies have focused on quantifying microplastics (MP) in the environment using μ-FTIR and Py-GC/MS, the most common analytical methods. However, their application to complex matrices like sediments is affected by interferences specific to each method. In this study, we developed a protocol combining μ-FTIR and Py-GC/MS for sequential analysis of MP (10–500 μm) in 16 river sediment samples, targeting PE, PP, and PS polymers. Mass concentrations were estimated from the particle volume in μ-FTIR and measured directly by Py-GC/MS using internal calibration. Results show consistency between the two methods across different sites, with variability of two orders of magnitude in concentration ranges from 0.3 to 50 items g<small><sup>−1</sup></small> and 0.2 to 17 μg g<small><sup>−1</sup></small> for μ-FTIR, and 0.8 to 21 μg g<small><sup>−1</sup></small> for Py-GC/MS. Replicate analyses (2 to 6 per site) revealed that intra-site variability was mainly influenced by sample preparation and, to a lesser extent, by the measurement technique. While estimated and measured concentrations were similar, discrepancies were observed in polymer proportions: PP predominated in μ-FTIR, while PS was more prevalent in Py-GC/MS. These differences are explained by the specific limitations of each method, especially the limited detection of synthetic fibres and tyre or road abrasion particles by μ-FTIR, which are detected as MP by Py-GC/MS. This comparative study provides recommendations for evaluating compatibility between studies using either technique and offers guidelines for selecting the most appropriate method based on research interests.</p>","PeriodicalId":64,"journal":{"name":"Analytical Methods","volume":" 18","pages":" 3781-3792"},"PeriodicalIF":2.6000,"publicationDate":"2025-04-11","publicationTypes":"Journal Article","fieldsOfStudy":null,"isOpenAccess":false,"openAccessPdf":"","citationCount":"0","resultStr":"{\"title\":\"Sequential combination of micro-FTIR imaging spectroscopy and pyrolysis-GC/MS for microplastic quantification. Application to river sediments†\",\"authors\":\"Nadia Bouzid, Bruno Tassin, Johnny Gasperi and Rachid Dris\",\"doi\":\"10.1039/D5AY00237K\",\"DOIUrl\":null,\"url\":null,\"abstract\":\"<p >Several studies have focused on quantifying microplastics (MP) in the environment using μ-FTIR and Py-GC/MS, the most common analytical methods. However, their application to complex matrices like sediments is affected by interferences specific to each method. In this study, we developed a protocol combining μ-FTIR and Py-GC/MS for sequential analysis of MP (10–500 μm) in 16 river sediment samples, targeting PE, PP, and PS polymers. Mass concentrations were estimated from the particle volume in μ-FTIR and measured directly by Py-GC/MS using internal calibration. Results show consistency between the two methods across different sites, with variability of two orders of magnitude in concentration ranges from 0.3 to 50 items g<small><sup>−1</sup></small> and 0.2 to 17 μg g<small><sup>−1</sup></small> for μ-FTIR, and 0.8 to 21 μg g<small><sup>−1</sup></small> for Py-GC/MS. Replicate analyses (2 to 6 per site) revealed that intra-site variability was mainly influenced by sample preparation and, to a lesser extent, by the measurement technique. While estimated and measured concentrations were similar, discrepancies were observed in polymer proportions: PP predominated in μ-FTIR, while PS was more prevalent in Py-GC/MS. These differences are explained by the specific limitations of each method, especially the limited detection of synthetic fibres and tyre or road abrasion particles by μ-FTIR, which are detected as MP by Py-GC/MS. This comparative study provides recommendations for evaluating compatibility between studies using either technique and offers guidelines for selecting the most appropriate method based on research interests.</p>\",\"PeriodicalId\":64,\"journal\":{\"name\":\"Analytical Methods\",\"volume\":\" 18\",\"pages\":\" 3781-3792\"},\"PeriodicalIF\":2.6000,\"publicationDate\":\"2025-04-11\",\"publicationTypes\":\"Journal Article\",\"fieldsOfStudy\":null,\"isOpenAccess\":false,\"openAccessPdf\":\"\",\"citationCount\":\"0\",\"resultStr\":null,\"platform\":\"Semanticscholar\",\"paperid\":null,\"PeriodicalName\":\"Analytical Methods\",\"FirstCategoryId\":\"92\",\"ListUrlMain\":\"https://pubs.rsc.org/en/content/articlelanding/2025/ay/d5ay00237k\",\"RegionNum\":3,\"RegionCategory\":\"化学\",\"ArticlePicture\":[],\"TitleCN\":null,\"AbstractTextCN\":null,\"PMCID\":null,\"EPubDate\":\"\",\"PubModel\":\"\",\"JCR\":\"Q2\",\"JCRName\":\"CHEMISTRY, ANALYTICAL\",\"Score\":null,\"Total\":0}","platform":"Semanticscholar","paperid":null,"PeriodicalName":"Analytical Methods","FirstCategoryId":"92","ListUrlMain":"https://pubs.rsc.org/en/content/articlelanding/2025/ay/d5ay00237k","RegionNum":3,"RegionCategory":"化学","ArticlePicture":[],"TitleCN":null,"AbstractTextCN":null,"PMCID":null,"EPubDate":"","PubModel":"","JCR":"Q2","JCRName":"CHEMISTRY, ANALYTICAL","Score":null,"Total":0}
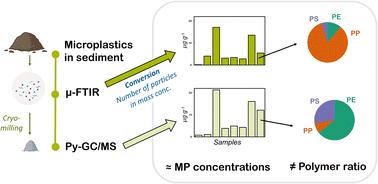
Sequential combination of micro-FTIR imaging spectroscopy and pyrolysis-GC/MS for microplastic quantification. Application to river sediments†
Several studies have focused on quantifying microplastics (MP) in the environment using μ-FTIR and Py-GC/MS, the most common analytical methods. However, their application to complex matrices like sediments is affected by interferences specific to each method. In this study, we developed a protocol combining μ-FTIR and Py-GC/MS for sequential analysis of MP (10–500 μm) in 16 river sediment samples, targeting PE, PP, and PS polymers. Mass concentrations were estimated from the particle volume in μ-FTIR and measured directly by Py-GC/MS using internal calibration. Results show consistency between the two methods across different sites, with variability of two orders of magnitude in concentration ranges from 0.3 to 50 items g−1 and 0.2 to 17 μg g−1 for μ-FTIR, and 0.8 to 21 μg g−1 for Py-GC/MS. Replicate analyses (2 to 6 per site) revealed that intra-site variability was mainly influenced by sample preparation and, to a lesser extent, by the measurement technique. While estimated and measured concentrations were similar, discrepancies were observed in polymer proportions: PP predominated in μ-FTIR, while PS was more prevalent in Py-GC/MS. These differences are explained by the specific limitations of each method, especially the limited detection of synthetic fibres and tyre or road abrasion particles by μ-FTIR, which are detected as MP by Py-GC/MS. This comparative study provides recommendations for evaluating compatibility between studies using either technique and offers guidelines for selecting the most appropriate method based on research interests.
 求助内容:
求助内容: 应助结果提醒方式:


