{"title":"卷扬机机构运行时的形态分析。","authors":"Takashi Shiroshita","doi":"10.1589/jpts.37.153","DOIUrl":null,"url":null,"abstract":"<p><p>[Purpose] To perform a morphological analysis of the foot windlass mechanism during running and compare it with previous studies. [Participants and Methods] Twenty healthy adults (14 males and six females) participated in this study. A VICON 3D motion-analysis device was used and the analysis used the medial longitudinal arch height model in addition to the full plug-in model. The medial longitudinal arch height, ankle joint internal plantar flexion moment, ankle joint angle, and movement of the center of gravity were measured. The focus was on running cycle synchrony and changes in the medial longitudinal arch height. A one-way analysis of variance for multiple comparisons was performed. [Results] The peak running cycles were 50.5% ± 0.6% for the ankle dorsiflexion angle, 54.4% ± 0.7% for the ankle moment, and 59.5% ± 1.7% for the medial longitudinal arch height, which were significantly different. The medial longitudinal arch showed a reverse windlass phenomenon, with a minimum of 17.1 mm at an approximately 60% running cycle and then a spike-like phenomenon of 29.1 mm at a 98% running cycle. [Conclusion] We did not observe synchronicity of any parameter, such as that observed during walking. The spike phenomenon that occurred during the 98% running cycle was the original windlass mechanism, which caused the push-off phenomenon.</p>","PeriodicalId":16834,"journal":{"name":"Journal of Physical Therapy Science","volume":"37 4","pages":"153-158"},"PeriodicalIF":0.0000,"publicationDate":"2025-04-01","publicationTypes":"Journal Article","fieldsOfStudy":null,"isOpenAccess":false,"openAccessPdf":"https://www.ncbi.nlm.nih.gov/pmc/articles/PMC11957739/pdf/","citationCount":"0","resultStr":"{\"title\":\"Morphological analysis of the windlass mechanism during running.\",\"authors\":\"Takashi Shiroshita\",\"doi\":\"10.1589/jpts.37.153\",\"DOIUrl\":null,\"url\":null,\"abstract\":\"<p><p>[Purpose] To perform a morphological analysis of the foot windlass mechanism during running and compare it with previous studies. [Participants and Methods] Twenty healthy adults (14 males and six females) participated in this study. A VICON 3D motion-analysis device was used and the analysis used the medial longitudinal arch height model in addition to the full plug-in model. The medial longitudinal arch height, ankle joint internal plantar flexion moment, ankle joint angle, and movement of the center of gravity were measured. The focus was on running cycle synchrony and changes in the medial longitudinal arch height. A one-way analysis of variance for multiple comparisons was performed. [Results] The peak running cycles were 50.5% ± 0.6% for the ankle dorsiflexion angle, 54.4% ± 0.7% for the ankle moment, and 59.5% ± 1.7% for the medial longitudinal arch height, which were significantly different. The medial longitudinal arch showed a reverse windlass phenomenon, with a minimum of 17.1 mm at an approximately 60% running cycle and then a spike-like phenomenon of 29.1 mm at a 98% running cycle. [Conclusion] We did not observe synchronicity of any parameter, such as that observed during walking. The spike phenomenon that occurred during the 98% running cycle was the original windlass mechanism, which caused the push-off phenomenon.</p>\",\"PeriodicalId\":16834,\"journal\":{\"name\":\"Journal of Physical Therapy Science\",\"volume\":\"37 4\",\"pages\":\"153-158\"},\"PeriodicalIF\":0.0000,\"publicationDate\":\"2025-04-01\",\"publicationTypes\":\"Journal Article\",\"fieldsOfStudy\":null,\"isOpenAccess\":false,\"openAccessPdf\":\"https://www.ncbi.nlm.nih.gov/pmc/articles/PMC11957739/pdf/\",\"citationCount\":\"0\",\"resultStr\":null,\"platform\":\"Semanticscholar\",\"paperid\":null,\"PeriodicalName\":\"Journal of Physical Therapy Science\",\"FirstCategoryId\":\"1085\",\"ListUrlMain\":\"https://doi.org/10.1589/jpts.37.153\",\"RegionNum\":0,\"RegionCategory\":null,\"ArticlePicture\":[],\"TitleCN\":null,\"AbstractTextCN\":null,\"PMCID\":null,\"EPubDate\":\"\",\"PubModel\":\"\",\"JCR\":\"\",\"JCRName\":\"\",\"Score\":null,\"Total\":0}","platform":"Semanticscholar","paperid":null,"PeriodicalName":"Journal of Physical Therapy Science","FirstCategoryId":"1085","ListUrlMain":"https://doi.org/10.1589/jpts.37.153","RegionNum":0,"RegionCategory":null,"ArticlePicture":[],"TitleCN":null,"AbstractTextCN":null,"PMCID":null,"EPubDate":"","PubModel":"","JCR":"","JCRName":"","Score":null,"Total":0}
Morphological analysis of the windlass mechanism during running.
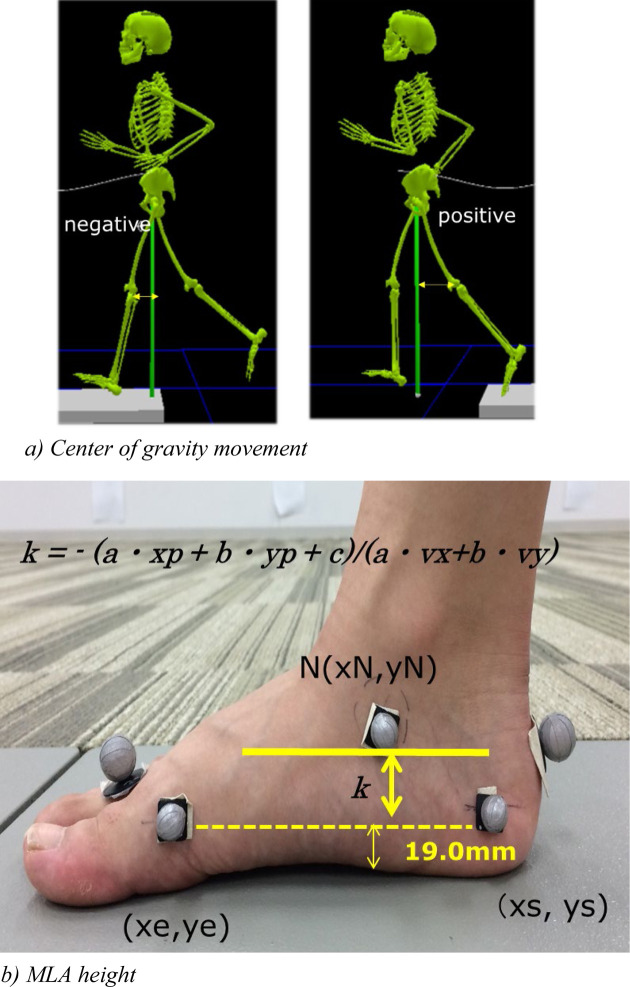
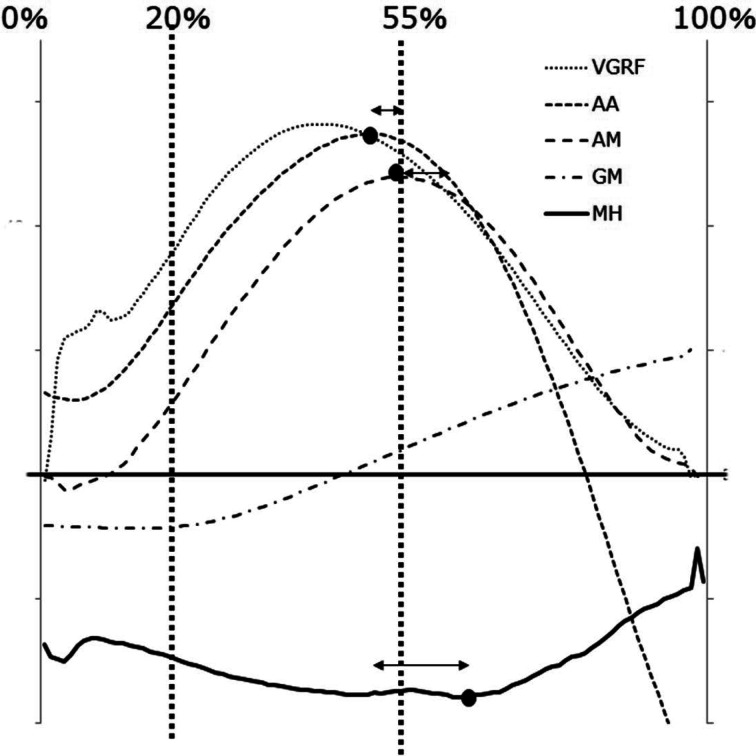
[Purpose] To perform a morphological analysis of the foot windlass mechanism during running and compare it with previous studies. [Participants and Methods] Twenty healthy adults (14 males and six females) participated in this study. A VICON 3D motion-analysis device was used and the analysis used the medial longitudinal arch height model in addition to the full plug-in model. The medial longitudinal arch height, ankle joint internal plantar flexion moment, ankle joint angle, and movement of the center of gravity were measured. The focus was on running cycle synchrony and changes in the medial longitudinal arch height. A one-way analysis of variance for multiple comparisons was performed. [Results] The peak running cycles were 50.5% ± 0.6% for the ankle dorsiflexion angle, 54.4% ± 0.7% for the ankle moment, and 59.5% ± 1.7% for the medial longitudinal arch height, which were significantly different. The medial longitudinal arch showed a reverse windlass phenomenon, with a minimum of 17.1 mm at an approximately 60% running cycle and then a spike-like phenomenon of 29.1 mm at a 98% running cycle. [Conclusion] We did not observe synchronicity of any parameter, such as that observed during walking. The spike phenomenon that occurred during the 98% running cycle was the original windlass mechanism, which caused the push-off phenomenon.

 求助内容:
求助内容: 应助结果提醒方式:


