{"title":"比较机器学习模型对藏族中老年妇女骨质疏松症的预测。","authors":"Peng Wang, Qiang Yin, Kangzhi Ding, Huaichang Zhong, Qundi Jia, Zhasang Xiao, Hai Xiong","doi":"10.1038/s41598-025-95707-2","DOIUrl":null,"url":null,"abstract":"<p><p>The aim of this study was to establish the optimal prediction model by comparing the prediction effect of 6 kinds of prediction models containing biochemical indexes on the risk of osteoporosis in middle-aged and elderly women in Tibet. This study adopted a multi-stage cluster random sampling cross-sectional survey method. From January 2022 to January 2024, we obtained biochemical and bone mineral density (BMD) data from high altitudes in Tibet. We built a predictive model of osteoporosis in three steps. First, we performed feature selection to identify factors associated with osteoporosis. Next, the eligible participants were randomly divided into a training set and a test set in a ratio of 8:2. Then, the prediction model of osteoporosis was established based on Random Forest, ANN, XGB, and SVM. Finally, we compared the performance of the prediction models using sensitivity, specificity, and the area under the receiver operating characteristic curve (AUC) to select the best prediction model. Correlation analysis was used to screen indicators with statistical differences from T-score. Finally, Age (P < 0.01), LDL-C (P < 0.05), UA (P < 0.01), AST (P < 0.05), CREA (P < 0.01), BMI (P < 0.01), ALT (P < 0.01) were associated with osteoporosis. In train set, the order of AUC from highest to lowest is Random Forest (1.000), XGB (0.887), SVM (0.868), regression (0.801), ANN (0.793) and OSTA (0.739). In test set, the order of AUC from highest to lowest is XGB (0.848), regression (0.801), Random Forest (0.772), SVM (0.755), OSTA (0.739), ANN (0.732). SVM and XGB algorithm models had better screening effect on osteoporosis than OSTA in middle-aged and elderly Tibetan residents in Tibet. Compared with Random Forest, ANN and SVM, the established XGB model had the best prediction ability and can be used to predict the risk of osteoporosis on biochemical indexes. The model needs to be further improved through large sample research.</p>","PeriodicalId":21811,"journal":{"name":"Scientific Reports","volume":"15 1","pages":"10960"},"PeriodicalIF":3.9000,"publicationDate":"2025-03-31","publicationTypes":"Journal Article","fieldsOfStudy":null,"isOpenAccess":false,"openAccessPdf":"https://www.ncbi.nlm.nih.gov/pmc/articles/PMC11958675/pdf/","citationCount":"0","resultStr":"{\"title\":\"Comparing machine learning models for osteoporosis prediction in Tibetan middle aged and elderly women.\",\"authors\":\"Peng Wang, Qiang Yin, Kangzhi Ding, Huaichang Zhong, Qundi Jia, Zhasang Xiao, Hai Xiong\",\"doi\":\"10.1038/s41598-025-95707-2\",\"DOIUrl\":null,\"url\":null,\"abstract\":\"<p><p>The aim of this study was to establish the optimal prediction model by comparing the prediction effect of 6 kinds of prediction models containing biochemical indexes on the risk of osteoporosis in middle-aged and elderly women in Tibet. This study adopted a multi-stage cluster random sampling cross-sectional survey method. From January 2022 to January 2024, we obtained biochemical and bone mineral density (BMD) data from high altitudes in Tibet. We built a predictive model of osteoporosis in three steps. First, we performed feature selection to identify factors associated with osteoporosis. Next, the eligible participants were randomly divided into a training set and a test set in a ratio of 8:2. Then, the prediction model of osteoporosis was established based on Random Forest, ANN, XGB, and SVM. Finally, we compared the performance of the prediction models using sensitivity, specificity, and the area under the receiver operating characteristic curve (AUC) to select the best prediction model. Correlation analysis was used to screen indicators with statistical differences from T-score. Finally, Age (P < 0.01), LDL-C (P < 0.05), UA (P < 0.01), AST (P < 0.05), CREA (P < 0.01), BMI (P < 0.01), ALT (P < 0.01) were associated with osteoporosis. In train set, the order of AUC from highest to lowest is Random Forest (1.000), XGB (0.887), SVM (0.868), regression (0.801), ANN (0.793) and OSTA (0.739). In test set, the order of AUC from highest to lowest is XGB (0.848), regression (0.801), Random Forest (0.772), SVM (0.755), OSTA (0.739), ANN (0.732). SVM and XGB algorithm models had better screening effect on osteoporosis than OSTA in middle-aged and elderly Tibetan residents in Tibet. Compared with Random Forest, ANN and SVM, the established XGB model had the best prediction ability and can be used to predict the risk of osteoporosis on biochemical indexes. The model needs to be further improved through large sample research.</p>\",\"PeriodicalId\":21811,\"journal\":{\"name\":\"Scientific Reports\",\"volume\":\"15 1\",\"pages\":\"10960\"},\"PeriodicalIF\":3.9000,\"publicationDate\":\"2025-03-31\",\"publicationTypes\":\"Journal Article\",\"fieldsOfStudy\":null,\"isOpenAccess\":false,\"openAccessPdf\":\"https://www.ncbi.nlm.nih.gov/pmc/articles/PMC11958675/pdf/\",\"citationCount\":\"0\",\"resultStr\":null,\"platform\":\"Semanticscholar\",\"paperid\":null,\"PeriodicalName\":\"Scientific Reports\",\"FirstCategoryId\":\"103\",\"ListUrlMain\":\"https://doi.org/10.1038/s41598-025-95707-2\",\"RegionNum\":2,\"RegionCategory\":\"综合性期刊\",\"ArticlePicture\":[],\"TitleCN\":null,\"AbstractTextCN\":null,\"PMCID\":null,\"EPubDate\":\"\",\"PubModel\":\"\",\"JCR\":\"Q1\",\"JCRName\":\"MULTIDISCIPLINARY SCIENCES\",\"Score\":null,\"Total\":0}","platform":"Semanticscholar","paperid":null,"PeriodicalName":"Scientific Reports","FirstCategoryId":"103","ListUrlMain":"https://doi.org/10.1038/s41598-025-95707-2","RegionNum":2,"RegionCategory":"综合性期刊","ArticlePicture":[],"TitleCN":null,"AbstractTextCN":null,"PMCID":null,"EPubDate":"","PubModel":"","JCR":"Q1","JCRName":"MULTIDISCIPLINARY SCIENCES","Score":null,"Total":0}
Comparing machine learning models for osteoporosis prediction in Tibetan middle aged and elderly women.
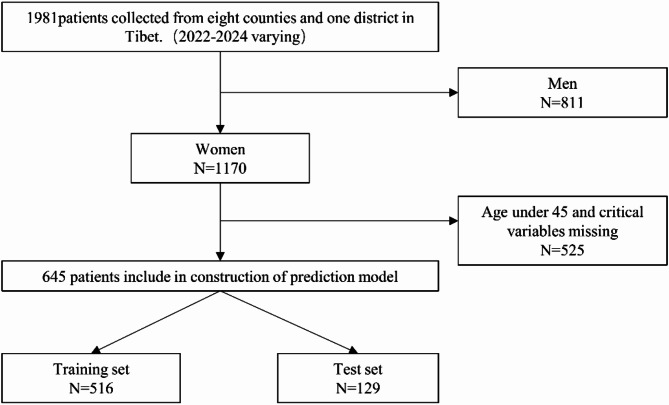
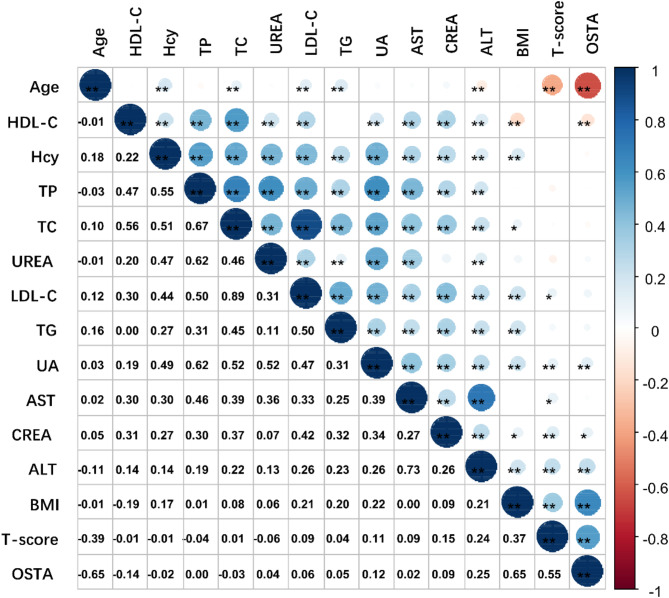
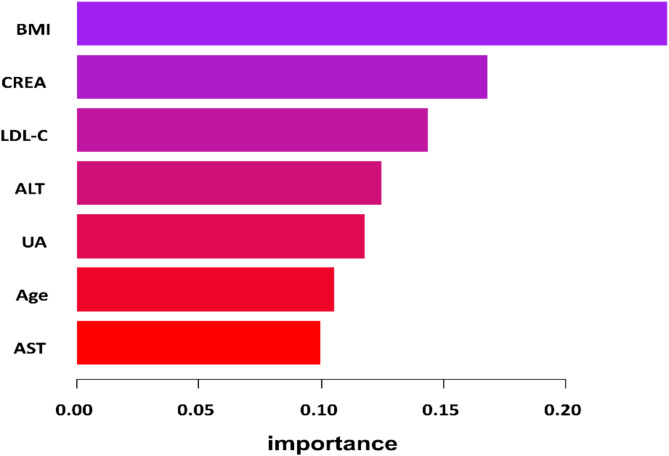
The aim of this study was to establish the optimal prediction model by comparing the prediction effect of 6 kinds of prediction models containing biochemical indexes on the risk of osteoporosis in middle-aged and elderly women in Tibet. This study adopted a multi-stage cluster random sampling cross-sectional survey method. From January 2022 to January 2024, we obtained biochemical and bone mineral density (BMD) data from high altitudes in Tibet. We built a predictive model of osteoporosis in three steps. First, we performed feature selection to identify factors associated with osteoporosis. Next, the eligible participants were randomly divided into a training set and a test set in a ratio of 8:2. Then, the prediction model of osteoporosis was established based on Random Forest, ANN, XGB, and SVM. Finally, we compared the performance of the prediction models using sensitivity, specificity, and the area under the receiver operating characteristic curve (AUC) to select the best prediction model. Correlation analysis was used to screen indicators with statistical differences from T-score. Finally, Age (P < 0.01), LDL-C (P < 0.05), UA (P < 0.01), AST (P < 0.05), CREA (P < 0.01), BMI (P < 0.01), ALT (P < 0.01) were associated with osteoporosis. In train set, the order of AUC from highest to lowest is Random Forest (1.000), XGB (0.887), SVM (0.868), regression (0.801), ANN (0.793) and OSTA (0.739). In test set, the order of AUC from highest to lowest is XGB (0.848), regression (0.801), Random Forest (0.772), SVM (0.755), OSTA (0.739), ANN (0.732). SVM and XGB algorithm models had better screening effect on osteoporosis than OSTA in middle-aged and elderly Tibetan residents in Tibet. Compared with Random Forest, ANN and SVM, the established XGB model had the best prediction ability and can be used to predict the risk of osteoporosis on biochemical indexes. The model needs to be further improved through large sample research.
期刊介绍:
We publish original research from all areas of the natural sciences, psychology, medicine and engineering. You can learn more about what we publish by browsing our specific scientific subject areas below or explore Scientific Reports by browsing all articles and collections.
Scientific Reports has a 2-year impact factor: 4.380 (2021), and is the 6th most-cited journal in the world, with more than 540,000 citations in 2020 (Clarivate Analytics, 2021).
•Engineering
Engineering covers all aspects of engineering, technology, and applied science. It plays a crucial role in the development of technologies to address some of the world''s biggest challenges, helping to save lives and improve the way we live.
•Physical sciences
Physical sciences are those academic disciplines that aim to uncover the underlying laws of nature — often written in the language of mathematics. It is a collective term for areas of study including astronomy, chemistry, materials science and physics.
•Earth and environmental sciences
Earth and environmental sciences cover all aspects of Earth and planetary science and broadly encompass solid Earth processes, surface and atmospheric dynamics, Earth system history, climate and climate change, marine and freshwater systems, and ecology. It also considers the interactions between humans and these systems.
•Biological sciences
Biological sciences encompass all the divisions of natural sciences examining various aspects of vital processes. The concept includes anatomy, physiology, cell biology, biochemistry and biophysics, and covers all organisms from microorganisms, animals to plants.
•Health sciences
The health sciences study health, disease and healthcare. This field of study aims to develop knowledge, interventions and technology for use in healthcare to improve the treatment of patients.

 求助内容:
求助内容: 应助结果提醒方式:


