{"title":"通过图形自动编码器了解股票市场的不稳定性。","authors":"Dragos Gorduza, Stefan Zohren, Xiaowen Dong","doi":"10.1140/epjds/s13688-025-00523-3","DOIUrl":null,"url":null,"abstract":"<p><p>Understanding stock market instability is a key question in financial management as practitioners seek to forecast breakdowns in long-run asset co-movement patterns which expose portfolios to rapid and devastating collapses in value. These disruptions are linked to changes in the structure of market wide stock correlations which increase the risk of high volatility shocks. The structure of these co-movements can be described as a network where companies are represented by nodes while edges capture correlations between their price movements. Co-movement breakdowns then manifest as abrupt changes in the topological structure of this network. Measuring the scale of this change and learning a timely indicator of breakdowns is central in understanding both financial stability and volatility forecasting. We propose to use the edge reconstruction accuracy of a graph auto-encoder as an indicator for how homogeneous connections between assets are, which we use, based on the literature of financial network analysis, as a proxy to infer market volatility. We show, through our experiments on the Standard and Poor's index over the 2015-2022 period, that the reconstruction errors from our model correlate with volatility spikes and can be used to improve out-of-sample autoregressive modeling of volatility. Our results demonstrate that market instability can be predicted by changes in the homogeneity in connections of the financial network which expands the understanding of instability in the stock market. We discuss the implications of this graph machine learning-based volatility estimation for policy targeted at ensuring financial market stability.</p>","PeriodicalId":11887,"journal":{"name":"EPJ Data Science","volume":"14 1","pages":"13"},"PeriodicalIF":2.5000,"publicationDate":"2025-01-01","publicationTypes":"Journal Article","fieldsOfStudy":null,"isOpenAccess":false,"openAccessPdf":"https://www.ncbi.nlm.nih.gov/pmc/articles/PMC11839781/pdf/","citationCount":"0","resultStr":"{\"title\":\"Understanding stock market instability via graph auto-encoders.\",\"authors\":\"Dragos Gorduza, Stefan Zohren, Xiaowen Dong\",\"doi\":\"10.1140/epjds/s13688-025-00523-3\",\"DOIUrl\":null,\"url\":null,\"abstract\":\"<p><p>Understanding stock market instability is a key question in financial management as practitioners seek to forecast breakdowns in long-run asset co-movement patterns which expose portfolios to rapid and devastating collapses in value. These disruptions are linked to changes in the structure of market wide stock correlations which increase the risk of high volatility shocks. The structure of these co-movements can be described as a network where companies are represented by nodes while edges capture correlations between their price movements. Co-movement breakdowns then manifest as abrupt changes in the topological structure of this network. Measuring the scale of this change and learning a timely indicator of breakdowns is central in understanding both financial stability and volatility forecasting. We propose to use the edge reconstruction accuracy of a graph auto-encoder as an indicator for how homogeneous connections between assets are, which we use, based on the literature of financial network analysis, as a proxy to infer market volatility. We show, through our experiments on the Standard and Poor's index over the 2015-2022 period, that the reconstruction errors from our model correlate with volatility spikes and can be used to improve out-of-sample autoregressive modeling of volatility. Our results demonstrate that market instability can be predicted by changes in the homogeneity in connections of the financial network which expands the understanding of instability in the stock market. We discuss the implications of this graph machine learning-based volatility estimation for policy targeted at ensuring financial market stability.</p>\",\"PeriodicalId\":11887,\"journal\":{\"name\":\"EPJ Data Science\",\"volume\":\"14 1\",\"pages\":\"13\"},\"PeriodicalIF\":2.5000,\"publicationDate\":\"2025-01-01\",\"publicationTypes\":\"Journal Article\",\"fieldsOfStudy\":null,\"isOpenAccess\":false,\"openAccessPdf\":\"https://www.ncbi.nlm.nih.gov/pmc/articles/PMC11839781/pdf/\",\"citationCount\":\"0\",\"resultStr\":null,\"platform\":\"Semanticscholar\",\"paperid\":null,\"PeriodicalName\":\"EPJ Data Science\",\"FirstCategoryId\":\"94\",\"ListUrlMain\":\"https://doi.org/10.1140/epjds/s13688-025-00523-3\",\"RegionNum\":2,\"RegionCategory\":\"计算机科学\",\"ArticlePicture\":[],\"TitleCN\":null,\"AbstractTextCN\":null,\"PMCID\":null,\"EPubDate\":\"2025/2/19 0:00:00\",\"PubModel\":\"Epub\",\"JCR\":\"Q1\",\"JCRName\":\"MATHEMATICS, INTERDISCIPLINARY APPLICATIONS\",\"Score\":null,\"Total\":0}","platform":"Semanticscholar","paperid":null,"PeriodicalName":"EPJ Data Science","FirstCategoryId":"94","ListUrlMain":"https://doi.org/10.1140/epjds/s13688-025-00523-3","RegionNum":2,"RegionCategory":"计算机科学","ArticlePicture":[],"TitleCN":null,"AbstractTextCN":null,"PMCID":null,"EPubDate":"2025/2/19 0:00:00","PubModel":"Epub","JCR":"Q1","JCRName":"MATHEMATICS, INTERDISCIPLINARY APPLICATIONS","Score":null,"Total":0}
Understanding stock market instability via graph auto-encoders.
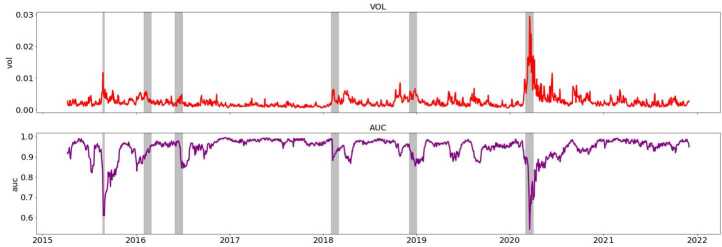
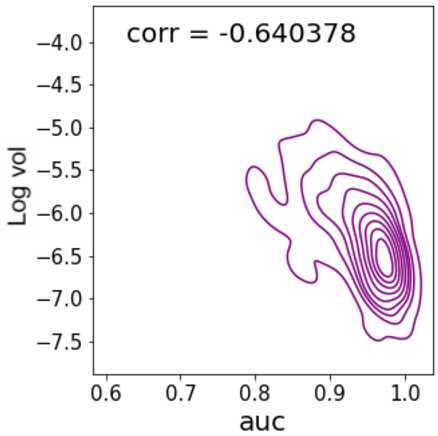
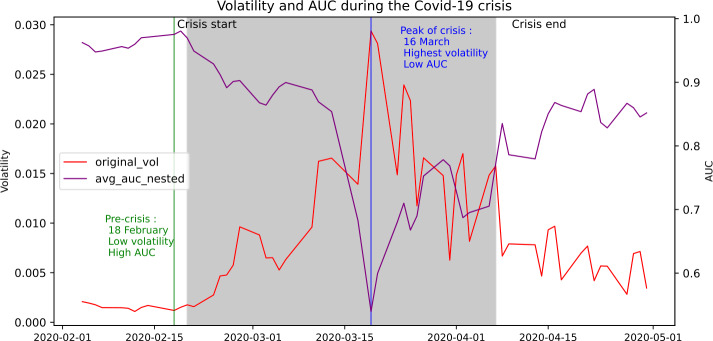
Understanding stock market instability is a key question in financial management as practitioners seek to forecast breakdowns in long-run asset co-movement patterns which expose portfolios to rapid and devastating collapses in value. These disruptions are linked to changes in the structure of market wide stock correlations which increase the risk of high volatility shocks. The structure of these co-movements can be described as a network where companies are represented by nodes while edges capture correlations between their price movements. Co-movement breakdowns then manifest as abrupt changes in the topological structure of this network. Measuring the scale of this change and learning a timely indicator of breakdowns is central in understanding both financial stability and volatility forecasting. We propose to use the edge reconstruction accuracy of a graph auto-encoder as an indicator for how homogeneous connections between assets are, which we use, based on the literature of financial network analysis, as a proxy to infer market volatility. We show, through our experiments on the Standard and Poor's index over the 2015-2022 period, that the reconstruction errors from our model correlate with volatility spikes and can be used to improve out-of-sample autoregressive modeling of volatility. Our results demonstrate that market instability can be predicted by changes in the homogeneity in connections of the financial network which expands the understanding of instability in the stock market. We discuss the implications of this graph machine learning-based volatility estimation for policy targeted at ensuring financial market stability.
期刊介绍:
EPJ Data Science covers a broad range of research areas and applications and particularly encourages contributions from techno-socio-economic systems, where it comprises those research lines that now regard the digital “tracks” of human beings as first-order objects for scientific investigation. Topics include, but are not limited to, human behavior, social interaction (including animal societies), economic and financial systems, management and business networks, socio-technical infrastructure, health and environmental systems, the science of science, as well as general risk and crisis scenario forecasting up to and including policy advice.

 求助内容:
求助内容: 应助结果提醒方式:


