Lamia Zaari Lambarki, Fayssal Jhilal, Lamia Slimani, Ridouan El Hajji, Fadil Bakkali, Samy Iskandar, Mariam El Jemli, Bouchaib Ihssane, Wafaa El Ghali, Taoufiq Saffaj
{"title":"血浆中索他洛尔HPLC生物分析方法检测限和定量限评估方法的比较。","authors":"Lamia Zaari Lambarki, Fayssal Jhilal, Lamia Slimani, Ridouan El Hajji, Fadil Bakkali, Samy Iskandar, Mariam El Jemli, Bouchaib Ihssane, Wafaa El Ghali, Taoufiq Saffaj","doi":"10.1038/s41598-024-83474-5","DOIUrl":null,"url":null,"abstract":"<p><p>The limit of detection (LOD) and limit of quantification (LOQ) stand elements in the validation of analytical and bioanalytical methods as emphasized in numerous guidelines. Despite this, the absence of a universal protocol for establishing these limits has led to varied approaches among researchers and analysts in literature. In this work we present the latest graphical strategy of validation known as the uncertainty profile to assess the LOQ and LOD. Then, we conducted a comparative study of this approach with those based on accuracy profile and parameters of the calibration curve. We realize the uncertainty profile from the uncertainty parameter calculated from the tolerance interval. Furthermore, we provide a succinct overview of alternative methods for computing these limits. This includes the classical strategy based on statistical concepts and graphical one using the method of accuracy profile. In pursuit of this objective, these strategies are implemented in the same experimental results of an HPLC method dedicated for the determination of sotalol in plasma using atenolol as internal standard. The classical strategy based on statistical concepts provides underestimated values of LOD and LOQ. In the other side, the two graphical tools give a relevant and realistic assessment, and the values LOD and LOQ found by uncertainty and accuracy profiles are in the same order of magnitude, especially the method of uncertainty profile. It provides precise estimate of the measurement uncertainty. The graphical strategies of validation, uncertainty profile and accuracy profile, based on tolerance interval are a reliable alternative to the classic strategy, based on classical concepts, for assessment of LOD and LOQ.</p>","PeriodicalId":21811,"journal":{"name":"Scientific Reports","volume":"15 1","pages":"5472"},"PeriodicalIF":3.9000,"publicationDate":"2025-02-14","publicationTypes":"Journal Article","fieldsOfStudy":null,"isOpenAccess":false,"openAccessPdf":"https://www.ncbi.nlm.nih.gov/pmc/articles/PMC11829023/pdf/","citationCount":"0","resultStr":"{\"title\":\"Comparison of approaches for assessing detection and quantitation limits in bioanalytical methods using HPLC for sotalol in plasma.\",\"authors\":\"Lamia Zaari Lambarki, Fayssal Jhilal, Lamia Slimani, Ridouan El Hajji, Fadil Bakkali, Samy Iskandar, Mariam El Jemli, Bouchaib Ihssane, Wafaa El Ghali, Taoufiq Saffaj\",\"doi\":\"10.1038/s41598-024-83474-5\",\"DOIUrl\":null,\"url\":null,\"abstract\":\"<p><p>The limit of detection (LOD) and limit of quantification (LOQ) stand elements in the validation of analytical and bioanalytical methods as emphasized in numerous guidelines. Despite this, the absence of a universal protocol for establishing these limits has led to varied approaches among researchers and analysts in literature. In this work we present the latest graphical strategy of validation known as the uncertainty profile to assess the LOQ and LOD. Then, we conducted a comparative study of this approach with those based on accuracy profile and parameters of the calibration curve. We realize the uncertainty profile from the uncertainty parameter calculated from the tolerance interval. Furthermore, we provide a succinct overview of alternative methods for computing these limits. This includes the classical strategy based on statistical concepts and graphical one using the method of accuracy profile. In pursuit of this objective, these strategies are implemented in the same experimental results of an HPLC method dedicated for the determination of sotalol in plasma using atenolol as internal standard. The classical strategy based on statistical concepts provides underestimated values of LOD and LOQ. In the other side, the two graphical tools give a relevant and realistic assessment, and the values LOD and LOQ found by uncertainty and accuracy profiles are in the same order of magnitude, especially the method of uncertainty profile. It provides precise estimate of the measurement uncertainty. The graphical strategies of validation, uncertainty profile and accuracy profile, based on tolerance interval are a reliable alternative to the classic strategy, based on classical concepts, for assessment of LOD and LOQ.</p>\",\"PeriodicalId\":21811,\"journal\":{\"name\":\"Scientific Reports\",\"volume\":\"15 1\",\"pages\":\"5472\"},\"PeriodicalIF\":3.9000,\"publicationDate\":\"2025-02-14\",\"publicationTypes\":\"Journal Article\",\"fieldsOfStudy\":null,\"isOpenAccess\":false,\"openAccessPdf\":\"https://www.ncbi.nlm.nih.gov/pmc/articles/PMC11829023/pdf/\",\"citationCount\":\"0\",\"resultStr\":null,\"platform\":\"Semanticscholar\",\"paperid\":null,\"PeriodicalName\":\"Scientific Reports\",\"FirstCategoryId\":\"103\",\"ListUrlMain\":\"https://doi.org/10.1038/s41598-024-83474-5\",\"RegionNum\":2,\"RegionCategory\":\"综合性期刊\",\"ArticlePicture\":[],\"TitleCN\":null,\"AbstractTextCN\":null,\"PMCID\":null,\"EPubDate\":\"\",\"PubModel\":\"\",\"JCR\":\"Q1\",\"JCRName\":\"MULTIDISCIPLINARY SCIENCES\",\"Score\":null,\"Total\":0}","platform":"Semanticscholar","paperid":null,"PeriodicalName":"Scientific Reports","FirstCategoryId":"103","ListUrlMain":"https://doi.org/10.1038/s41598-024-83474-5","RegionNum":2,"RegionCategory":"综合性期刊","ArticlePicture":[],"TitleCN":null,"AbstractTextCN":null,"PMCID":null,"EPubDate":"","PubModel":"","JCR":"Q1","JCRName":"MULTIDISCIPLINARY SCIENCES","Score":null,"Total":0}
Comparison of approaches for assessing detection and quantitation limits in bioanalytical methods using HPLC for sotalol in plasma.
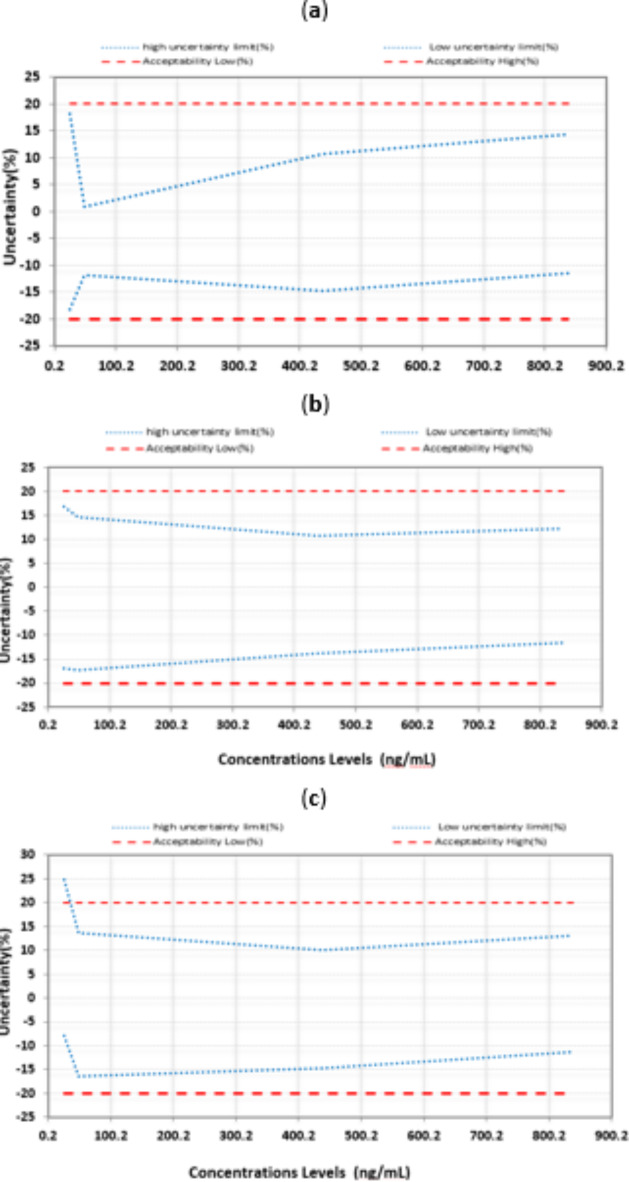
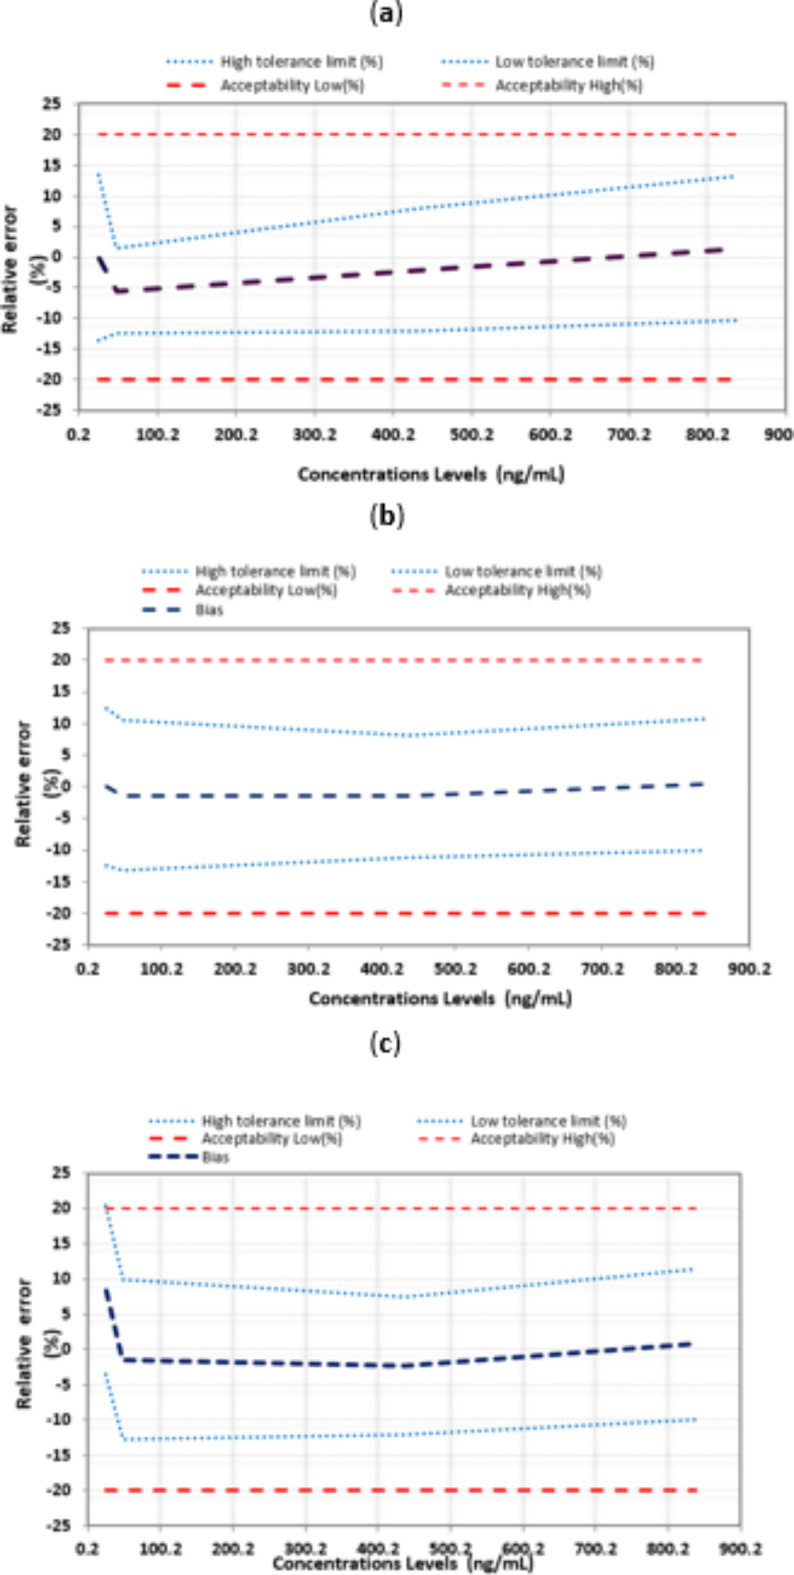
The limit of detection (LOD) and limit of quantification (LOQ) stand elements in the validation of analytical and bioanalytical methods as emphasized in numerous guidelines. Despite this, the absence of a universal protocol for establishing these limits has led to varied approaches among researchers and analysts in literature. In this work we present the latest graphical strategy of validation known as the uncertainty profile to assess the LOQ and LOD. Then, we conducted a comparative study of this approach with those based on accuracy profile and parameters of the calibration curve. We realize the uncertainty profile from the uncertainty parameter calculated from the tolerance interval. Furthermore, we provide a succinct overview of alternative methods for computing these limits. This includes the classical strategy based on statistical concepts and graphical one using the method of accuracy profile. In pursuit of this objective, these strategies are implemented in the same experimental results of an HPLC method dedicated for the determination of sotalol in plasma using atenolol as internal standard. The classical strategy based on statistical concepts provides underestimated values of LOD and LOQ. In the other side, the two graphical tools give a relevant and realistic assessment, and the values LOD and LOQ found by uncertainty and accuracy profiles are in the same order of magnitude, especially the method of uncertainty profile. It provides precise estimate of the measurement uncertainty. The graphical strategies of validation, uncertainty profile and accuracy profile, based on tolerance interval are a reliable alternative to the classic strategy, based on classical concepts, for assessment of LOD and LOQ.
期刊介绍:
We publish original research from all areas of the natural sciences, psychology, medicine and engineering. You can learn more about what we publish by browsing our specific scientific subject areas below or explore Scientific Reports by browsing all articles and collections.
Scientific Reports has a 2-year impact factor: 4.380 (2021), and is the 6th most-cited journal in the world, with more than 540,000 citations in 2020 (Clarivate Analytics, 2021).
•Engineering
Engineering covers all aspects of engineering, technology, and applied science. It plays a crucial role in the development of technologies to address some of the world''s biggest challenges, helping to save lives and improve the way we live.
•Physical sciences
Physical sciences are those academic disciplines that aim to uncover the underlying laws of nature — often written in the language of mathematics. It is a collective term for areas of study including astronomy, chemistry, materials science and physics.
•Earth and environmental sciences
Earth and environmental sciences cover all aspects of Earth and planetary science and broadly encompass solid Earth processes, surface and atmospheric dynamics, Earth system history, climate and climate change, marine and freshwater systems, and ecology. It also considers the interactions between humans and these systems.
•Biological sciences
Biological sciences encompass all the divisions of natural sciences examining various aspects of vital processes. The concept includes anatomy, physiology, cell biology, biochemistry and biophysics, and covers all organisms from microorganisms, animals to plants.
•Health sciences
The health sciences study health, disease and healthcare. This field of study aims to develop knowledge, interventions and technology for use in healthcare to improve the treatment of patients.

 求助内容:
求助内容: 应助结果提醒方式:


