Ting C. Lin, Elizabeth E. Bickel Rogers, Aditya Bhan
{"title":"热催化CO2加氢的动力学和热力学考虑","authors":"Ting C. Lin, Elizabeth E. Bickel Rogers, Aditya Bhan","doi":"10.1021/acscatal.4c05805","DOIUrl":null,"url":null,"abstract":"<span><sup>a</sup></span>Stoichiometric amounts of H<sub>2</sub> and H<sub>2</sub>O were omitted. How can the reaction network connectivity between CO<sub>2</sub>, CO, and hydrocarbon/oxygenate products be determined to assess pathway-specific rates? How can thermodynamic contributions to observed trends in rates and selectivity be identified and decoupled from kinetic contributions? How can relationships between and constraints imposed by thermodynamic driving forces be illustrated in energy diagrams? Figure 1. (a) Hypothetical reaction networks where <i>A</i> converts to <i>B</i>, <i>C</i>, <i>D</i>, and <i>E</i> following two cases: (i) <i>C</i> is a secondary product with no product inhibition present, and (ii) all species are primary products with <i>E</i> inhibiting the formation rates of <i>B</i> and <i>D</i>. Here, <i>C</i><sub><i>E</i></sub> denotes the concentration of species <i>E</i>. (b, c) Simulated first rank delplots and (d, e) yields as a function of contact time for the two cases. Inset in (c) shows the selectivity to product <i>C</i> over the 0–3% conversion region of the first rank plot for case (ii). (f) Simulated TOFs as a function of contact time for case (i). Values of rate and equilibrium constants were chosen for illustrative purposes and do not impact the general trends shown. Arbitrary units are abbreviated as a.u. Simulation details are provided in section S1 (Supporting Information (SI)). Figure 2. Simulated (a) overall reversibility and (b) carbon selectivity as a function of contact time during CO<sub>2</sub> hydrogenation to methanol, CO, and ethanol on a hypothetical catalyst kinetically selective toward methanol (30 bar; 503 K; 1 a.u. total inlet flow rate; H<sub>2</sub>:CO<sub>2</sub> = 3). (c) Calculated equilibrium carbon selectivity (30 bar; H<sub>2</sub>:CO<sub>2</sub> = 3) as a function of temperature, where the methanol selectivity is too low to be observed in the figure. The result at 503 K is highlighted and expectedly consistent with selectivity from (b) in the limit of infinite contact time. Simulation details are provided in section S3 (SI). Figure 3. (a) Free energy diagrams at the standard state (<i>C</i><sub>0</sub> = 1 a.u.) and under reaction conditions (initial <i>C</i><sub><i>A</i>,0</sub> = 10 a.u.; <i>X</i><sub><i>A</i></sub> = 0.23) for single-path reaction sequence <i>A</i> ⇄ <i>B</i> ⇄ <i>C</i> ⇄ <i>D</i>. (b) Free energy diagrams for CO<sub>2</sub> hydrogenation at 523 K referenced to CO<sub>2</sub> + 3H<sub>2</sub> at the standard state (<i>P</i><sub>0</sub> = 1 bar), hypothetical reaction condition 1 (<i>P</i><sub>tot</sub> = 10 bar; inlet CO<sub>2</sub>:H<sub>2</sub> = 1:3; <i>X</i><sub>CO<sub>2</sub></sub> = 0.03; <i>S</i><sub>CH<sub>3</sub>OH</sub> = 0.5), and hypothetical reaction condition 2 (<i>P</i><sub>tot</sub> = 10 bar; inlet CO<sub>2</sub>:H<sub>2</sub> = 1:3; <i>X</i><sub>CO<sub>2</sub></sub> = 0.03; <i>S</i><sub>CH<sub>3</sub>OH</sub> = 0.05) calculated based on values from ref (10). The values of the initial concentration of reactants and conversion in both examples were chosen to outline an illustrative example (details in section S4, SI). Figure 4. (a) Reaction condition free energy diagram with increasing extent of reaction, (b) <i>z</i><sub><i>i</i></sub> as a function of conversion of <i>A</i>, and (c) <i>X</i><sub>ZC,<i>i</i></sub> as a function of conversion of <i>A</i> for single-path reaction sequence <i>A</i> ⇄ <i>B</i> ⇄ <i>C</i> ⇄ <i>D</i>. Simulation details are provided in section S4 (SI). combining delplot analysis, Wojciechowski’s criterion, product cofeed experiments, reversibility considerations, and isotopic tracing to elucidate the reaction network of CO<sub>2</sub> hydrogenation such that observed rates can be attributed to specific reaction pathways, deconvoluting thermodynamic and kinetic driving forces for each reaction pathway through reversibility formalisms with consistent length-scales (differential vs integral models) such that forward rates and selectivity can be related to catalyst properties, and acknowledging the dependence of kinetic and thermodynamic driving forces on the extent of reaction, which can be illustrated through reaction condition energy diagrams as opposed to standard-state energy diagrams. The Supporting Information is available free of charge at https://pubs.acs.org/doi/10.1021/acscatal.4c05805. Simulation details and MATLAB code for delplot analysis and Wojciechowski’s criterion, for evaluating equilibrium selectivity, and for standard and reaction condition energy diagrams, as well as simulated delplots for nonfirst order reactions (PDF) Kinetic and Thermodynamic\nConsiderations in Thermocatalytic\nCO<sub>2</sub> Hydrogenation <span> 0 </span><span> views </span> <span> 0 </span><span> shares </span> <span> 0 </span><span> downloads </span> Most electronic Supporting Information files are available without a subscription to ACS Web Editions. Such files may be downloaded by article for research use (if there is a public use license linked to the relevant article, that license may permit other uses). Permission may be obtained from ACS for other uses through requests via the RightsLink permission system: http://pubs.acs.org/page/copyright/permissions.html. T.C.L. and E.E.B.R. contributed equally to this work. The authors acknowledge financial support from the U.S. Department of Energy, Office of Basic Energy Science, Catalysis Science Program under Award DE-SC0025321 and from the University of Minnesota, College of Science and Engineering. This material is also based upon work supported by the National Science Foundation Graduate Research Fellowship under Grant 2237827. This article references 19 other publications. This article has not yet been cited by other publications.","PeriodicalId":9,"journal":{"name":"ACS Catalysis ","volume":"1 1","pages":""},"PeriodicalIF":11.3000,"publicationDate":"2024-12-26","publicationTypes":"Journal Article","fieldsOfStudy":null,"isOpenAccess":false,"openAccessPdf":"","citationCount":"0","resultStr":"{\"title\":\"Kinetic and Thermodynamic Considerations in Thermocatalytic CO2 Hydrogenation\",\"authors\":\"Ting C. Lin, Elizabeth E. Bickel Rogers, Aditya Bhan\",\"doi\":\"10.1021/acscatal.4c05805\",\"DOIUrl\":null,\"url\":null,\"abstract\":\"<span><sup>a</sup></span>Stoichiometric amounts of H<sub>2</sub> and H<sub>2</sub>O were omitted. How can the reaction network connectivity between CO<sub>2</sub>, CO, and hydrocarbon/oxygenate products be determined to assess pathway-specific rates? How can thermodynamic contributions to observed trends in rates and selectivity be identified and decoupled from kinetic contributions? How can relationships between and constraints imposed by thermodynamic driving forces be illustrated in energy diagrams? Figure 1. (a) Hypothetical reaction networks where <i>A</i> converts to <i>B</i>, <i>C</i>, <i>D</i>, and <i>E</i> following two cases: (i) <i>C</i> is a secondary product with no product inhibition present, and (ii) all species are primary products with <i>E</i> inhibiting the formation rates of <i>B</i> and <i>D</i>. Here, <i>C</i><sub><i>E</i></sub> denotes the concentration of species <i>E</i>. (b, c) Simulated first rank delplots and (d, e) yields as a function of contact time for the two cases. Inset in (c) shows the selectivity to product <i>C</i> over the 0–3% conversion region of the first rank plot for case (ii). (f) Simulated TOFs as a function of contact time for case (i). Values of rate and equilibrium constants were chosen for illustrative purposes and do not impact the general trends shown. Arbitrary units are abbreviated as a.u. Simulation details are provided in section S1 (Supporting Information (SI)). Figure 2. Simulated (a) overall reversibility and (b) carbon selectivity as a function of contact time during CO<sub>2</sub> hydrogenation to methanol, CO, and ethanol on a hypothetical catalyst kinetically selective toward methanol (30 bar; 503 K; 1 a.u. total inlet flow rate; H<sub>2</sub>:CO<sub>2</sub> = 3). (c) Calculated equilibrium carbon selectivity (30 bar; H<sub>2</sub>:CO<sub>2</sub> = 3) as a function of temperature, where the methanol selectivity is too low to be observed in the figure. The result at 503 K is highlighted and expectedly consistent with selectivity from (b) in the limit of infinite contact time. Simulation details are provided in section S3 (SI). Figure 3. (a) Free energy diagrams at the standard state (<i>C</i><sub>0</sub> = 1 a.u.) and under reaction conditions (initial <i>C</i><sub><i>A</i>,0</sub> = 10 a.u.; <i>X</i><sub><i>A</i></sub> = 0.23) for single-path reaction sequence <i>A</i> ⇄ <i>B</i> ⇄ <i>C</i> ⇄ <i>D</i>. (b) Free energy diagrams for CO<sub>2</sub> hydrogenation at 523 K referenced to CO<sub>2</sub> + 3H<sub>2</sub> at the standard state (<i>P</i><sub>0</sub> = 1 bar), hypothetical reaction condition 1 (<i>P</i><sub>tot</sub> = 10 bar; inlet CO<sub>2</sub>:H<sub>2</sub> = 1:3; <i>X</i><sub>CO<sub>2</sub></sub> = 0.03; <i>S</i><sub>CH<sub>3</sub>OH</sub> = 0.5), and hypothetical reaction condition 2 (<i>P</i><sub>tot</sub> = 10 bar; inlet CO<sub>2</sub>:H<sub>2</sub> = 1:3; <i>X</i><sub>CO<sub>2</sub></sub> = 0.03; <i>S</i><sub>CH<sub>3</sub>OH</sub> = 0.05) calculated based on values from ref (10). The values of the initial concentration of reactants and conversion in both examples were chosen to outline an illustrative example (details in section S4, SI). Figure 4. (a) Reaction condition free energy diagram with increasing extent of reaction, (b) <i>z</i><sub><i>i</i></sub> as a function of conversion of <i>A</i>, and (c) <i>X</i><sub>ZC,<i>i</i></sub> as a function of conversion of <i>A</i> for single-path reaction sequence <i>A</i> ⇄ <i>B</i> ⇄ <i>C</i> ⇄ <i>D</i>. Simulation details are provided in section S4 (SI). combining delplot analysis, Wojciechowski’s criterion, product cofeed experiments, reversibility considerations, and isotopic tracing to elucidate the reaction network of CO<sub>2</sub> hydrogenation such that observed rates can be attributed to specific reaction pathways, deconvoluting thermodynamic and kinetic driving forces for each reaction pathway through reversibility formalisms with consistent length-scales (differential vs integral models) such that forward rates and selectivity can be related to catalyst properties, and acknowledging the dependence of kinetic and thermodynamic driving forces on the extent of reaction, which can be illustrated through reaction condition energy diagrams as opposed to standard-state energy diagrams. The Supporting Information is available free of charge at https://pubs.acs.org/doi/10.1021/acscatal.4c05805. Simulation details and MATLAB code for delplot analysis and Wojciechowski’s criterion, for evaluating equilibrium selectivity, and for standard and reaction condition energy diagrams, as well as simulated delplots for nonfirst order reactions (PDF) Kinetic and Thermodynamic\\nConsiderations in Thermocatalytic\\nCO<sub>2</sub> Hydrogenation <span> 0 </span><span> views </span> <span> 0 </span><span> shares </span> <span> 0 </span><span> downloads </span> Most electronic Supporting Information files are available without a subscription to ACS Web Editions. Such files may be downloaded by article for research use (if there is a public use license linked to the relevant article, that license may permit other uses). Permission may be obtained from ACS for other uses through requests via the RightsLink permission system: http://pubs.acs.org/page/copyright/permissions.html. T.C.L. and E.E.B.R. contributed equally to this work. The authors acknowledge financial support from the U.S. Department of Energy, Office of Basic Energy Science, Catalysis Science Program under Award DE-SC0025321 and from the University of Minnesota, College of Science and Engineering. This material is also based upon work supported by the National Science Foundation Graduate Research Fellowship under Grant 2237827. This article references 19 other publications. This article has not yet been cited by other publications.\",\"PeriodicalId\":9,\"journal\":{\"name\":\"ACS Catalysis \",\"volume\":\"1 1\",\"pages\":\"\"},\"PeriodicalIF\":11.3000,\"publicationDate\":\"2024-12-26\",\"publicationTypes\":\"Journal Article\",\"fieldsOfStudy\":null,\"isOpenAccess\":false,\"openAccessPdf\":\"\",\"citationCount\":\"0\",\"resultStr\":null,\"platform\":\"Semanticscholar\",\"paperid\":null,\"PeriodicalName\":\"ACS Catalysis \",\"FirstCategoryId\":\"92\",\"ListUrlMain\":\"https://doi.org/10.1021/acscatal.4c05805\",\"RegionNum\":1,\"RegionCategory\":\"化学\",\"ArticlePicture\":[],\"TitleCN\":null,\"AbstractTextCN\":null,\"PMCID\":null,\"EPubDate\":\"\",\"PubModel\":\"\",\"JCR\":\"Q1\",\"JCRName\":\"CHEMISTRY, PHYSICAL\",\"Score\":null,\"Total\":0}","platform":"Semanticscholar","paperid":null,"PeriodicalName":"ACS Catalysis ","FirstCategoryId":"92","ListUrlMain":"https://doi.org/10.1021/acscatal.4c05805","RegionNum":1,"RegionCategory":"化学","ArticlePicture":[],"TitleCN":null,"AbstractTextCN":null,"PMCID":null,"EPubDate":"","PubModel":"","JCR":"Q1","JCRName":"CHEMISTRY, PHYSICAL","Score":null,"Total":0}
Kinetic and Thermodynamic Considerations in Thermocatalytic CO2 Hydrogenation
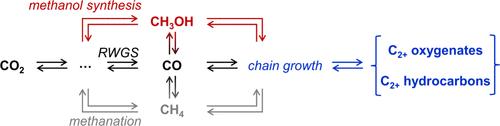
aStoichiometric amounts of H2 and H2O were omitted. How can the reaction network connectivity between CO2, CO, and hydrocarbon/oxygenate products be determined to assess pathway-specific rates? How can thermodynamic contributions to observed trends in rates and selectivity be identified and decoupled from kinetic contributions? How can relationships between and constraints imposed by thermodynamic driving forces be illustrated in energy diagrams? Figure 1. (a) Hypothetical reaction networks where A converts to B, C, D, and E following two cases: (i) C is a secondary product with no product inhibition present, and (ii) all species are primary products with E inhibiting the formation rates of B and D. Here, CE denotes the concentration of species E. (b, c) Simulated first rank delplots and (d, e) yields as a function of contact time for the two cases. Inset in (c) shows the selectivity to product C over the 0–3% conversion region of the first rank plot for case (ii). (f) Simulated TOFs as a function of contact time for case (i). Values of rate and equilibrium constants were chosen for illustrative purposes and do not impact the general trends shown. Arbitrary units are abbreviated as a.u. Simulation details are provided in section S1 (Supporting Information (SI)). Figure 2. Simulated (a) overall reversibility and (b) carbon selectivity as a function of contact time during CO2 hydrogenation to methanol, CO, and ethanol on a hypothetical catalyst kinetically selective toward methanol (30 bar; 503 K; 1 a.u. total inlet flow rate; H2:CO2 = 3). (c) Calculated equilibrium carbon selectivity (30 bar; H2:CO2 = 3) as a function of temperature, where the methanol selectivity is too low to be observed in the figure. The result at 503 K is highlighted and expectedly consistent with selectivity from (b) in the limit of infinite contact time. Simulation details are provided in section S3 (SI). Figure 3. (a) Free energy diagrams at the standard state (C0 = 1 a.u.) and under reaction conditions (initial CA,0 = 10 a.u.; XA = 0.23) for single-path reaction sequence A ⇄ B ⇄ C ⇄ D. (b) Free energy diagrams for CO2 hydrogenation at 523 K referenced to CO2 + 3H2 at the standard state (P0 = 1 bar), hypothetical reaction condition 1 (Ptot = 10 bar; inlet CO2:H2 = 1:3; XCO2 = 0.03; SCH3OH = 0.5), and hypothetical reaction condition 2 (Ptot = 10 bar; inlet CO2:H2 = 1:3; XCO2 = 0.03; SCH3OH = 0.05) calculated based on values from ref (10). The values of the initial concentration of reactants and conversion in both examples were chosen to outline an illustrative example (details in section S4, SI). Figure 4. (a) Reaction condition free energy diagram with increasing extent of reaction, (b) zi as a function of conversion of A, and (c) XZC,i as a function of conversion of A for single-path reaction sequence A ⇄ B ⇄ C ⇄ D. Simulation details are provided in section S4 (SI). combining delplot analysis, Wojciechowski’s criterion, product cofeed experiments, reversibility considerations, and isotopic tracing to elucidate the reaction network of CO2 hydrogenation such that observed rates can be attributed to specific reaction pathways, deconvoluting thermodynamic and kinetic driving forces for each reaction pathway through reversibility formalisms with consistent length-scales (differential vs integral models) such that forward rates and selectivity can be related to catalyst properties, and acknowledging the dependence of kinetic and thermodynamic driving forces on the extent of reaction, which can be illustrated through reaction condition energy diagrams as opposed to standard-state energy diagrams. The Supporting Information is available free of charge at https://pubs.acs.org/doi/10.1021/acscatal.4c05805. Simulation details and MATLAB code for delplot analysis and Wojciechowski’s criterion, for evaluating equilibrium selectivity, and for standard and reaction condition energy diagrams, as well as simulated delplots for nonfirst order reactions (PDF) Kinetic and Thermodynamic
Considerations in Thermocatalytic
CO2 Hydrogenation 0 views 0 shares 0 downloads Most electronic Supporting Information files are available without a subscription to ACS Web Editions. Such files may be downloaded by article for research use (if there is a public use license linked to the relevant article, that license may permit other uses). Permission may be obtained from ACS for other uses through requests via the RightsLink permission system: http://pubs.acs.org/page/copyright/permissions.html. T.C.L. and E.E.B.R. contributed equally to this work. The authors acknowledge financial support from the U.S. Department of Energy, Office of Basic Energy Science, Catalysis Science Program under Award DE-SC0025321 and from the University of Minnesota, College of Science and Engineering. This material is also based upon work supported by the National Science Foundation Graduate Research Fellowship under Grant 2237827. This article references 19 other publications. This article has not yet been cited by other publications.
期刊介绍:
ACS Catalysis is an esteemed journal that publishes original research in the fields of heterogeneous catalysis, molecular catalysis, and biocatalysis. It offers broad coverage across diverse areas such as life sciences, organometallics and synthesis, photochemistry and electrochemistry, drug discovery and synthesis, materials science, environmental protection, polymer discovery and synthesis, and energy and fuels.
The scope of the journal is to showcase innovative work in various aspects of catalysis. This includes new reactions and novel synthetic approaches utilizing known catalysts, the discovery or modification of new catalysts, elucidation of catalytic mechanisms through cutting-edge investigations, practical enhancements of existing processes, as well as conceptual advances in the field. Contributions to ACS Catalysis can encompass both experimental and theoretical research focused on catalytic molecules, macromolecules, and materials that exhibit catalytic turnover.
 求助内容:
求助内容: 应助结果提醒方式:


