将激发-发射矩阵荧光光谱和化学计量学应用于乳化油浓度的定量分析。
IF 4.3
2区 化学
Q1 SPECTROSCOPY
Spectrochimica Acta Part A: Molecular and Biomolecular Spectroscopy
Pub Date : 2024-11-17
DOI:10.1016/j.saa.2024.125423
引用次数: 0
摘要
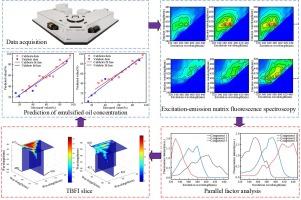
乳化油浓度是定量分析海面溢油污染的重要指标,建立快速有效的乳化油浓度定量分析方法对溢油量估算和溢油后评估具有重要作用。本文提出了一种基于激发-发射矩阵(EEM)荧光光谱和化学计量学的乳化油浓度定量分析方法。首先,使用 FLS1000 荧光光谱仪测量了两种乳化油的 EEM 荧光光谱。然后,利用并行因子分析(PARAFAC)对所测得的 EEM 荧光光谱进行分解,并从分解得到的载荷矩阵中筛选出几个关键的激发波长。随后,计算这些激发波长的三波段荧光指数(TBFI),并结合最佳波段选择算法,从中选出最佳发射波段组合。最后,将选定的最佳发射波段与偏最小二乘回归(PLSR)相结合,建立乳化油浓度预测模型。通过与基于 PARAFAC-PLSR 和多变量曲线解析-最小二乘(MCR-ALS)-PLSR 模型的预测结果进行比较,TBFI-PLSR 模型在乳化油浓度的定量分析中显示出最佳结果。汽油和柴油乳化液验证集的判定系数、均方相对误差和性能与四分位距之比分别为 0.93、3.67%、4.72 和 0.93、3.72%、4.60。本文章由计算机程序翻译,如有差异,请以英文原文为准。
Application of excitation-emission matrix fluorescence spectroscopy and chemometrics for quantitative analysis of emulsified oil concentration
Emulsified oil concentration is an important index for quantitative analysis of sea surface oil spill pollution, and the development of a fast and effective quantitative analysis method for emulsified oil concentration plays a crucial role in the estimation of oil spill volume and post-spill assessment. A quantitative analysis method for emulsified oil concentration based on excitation-emission matrix (EEM) fluorescence spectroscopy and chemometrics was proposed. Firstly, the EEM fluorescence spectra of two emulsified oils were measured using a FLS1000 fluorescence spectrometer. Then, the measured EEM fluorescence spectra were decomposed by parallel factor analysis (PARAFAC), and several key excitation wavelengths were filtered from the loading matrix obtained from the decomposition. Subsequently, the three-band fluorescence index (TBFI) at these excitation wavelengths was calculated and combined with the optimal band selection algorithm, from which the optimal emission band combinations were selected. Finally, the selected optimal emission bands were combined with partial least squares regression (PLSR) to establish a prediction model for emulsified oil concentration. By comparing the prediction results with those based on PARAFAC-PLSR and multivariate curve resolved-alternating least squares (MCR-ALS)-PLSR models, the TBFI-PLSR model showed the best results in the quantitative analysis of emulsified oil concentration. The coefficient of determination, mean square relative error, and ratio of performance to interquartile distance for the gasoline and diesel fuel emulsion validation sets were 0.93, 3.67%, 4.72, and 0.93, 3.72%, 4.60, respectively.
求助全文
通过发布文献求助,成功后即可免费获取论文全文。
去求助
来源期刊
CiteScore
8.40
自引率
11.40%
发文量
1364
审稿时长
40 days
期刊介绍:
Spectrochimica Acta, Part A: Molecular and Biomolecular Spectroscopy (SAA) is an interdisciplinary journal which spans from basic to applied aspects of optical spectroscopy in chemistry, medicine, biology, and materials science.
The journal publishes original scientific papers that feature high-quality spectroscopic data and analysis. From the broad range of optical spectroscopies, the emphasis is on electronic, vibrational or rotational spectra of molecules, rather than on spectroscopy based on magnetic moments.
Criteria for publication in SAA are novelty, uniqueness, and outstanding quality. Routine applications of spectroscopic techniques and computational methods are not appropriate.
Topics of particular interest of Spectrochimica Acta Part A include, but are not limited to:
Spectroscopy and dynamics of bioanalytical, biomedical, environmental, and atmospheric sciences,
Novel experimental techniques or instrumentation for molecular spectroscopy,
Novel theoretical and computational methods,
Novel applications in photochemistry and photobiology,
Novel interpretational approaches as well as advances in data analysis based on electronic or vibrational spectroscopy.
 求助内容:
求助内容: 应助结果提醒方式:


