Suganthi Jaganathan , Ajit Rajiva , Heresh Amini , Jeroen de Bont , Shweta Dixit , Anubrati Dutta , Itai Kloog , Kevin J. Lane , Jyothi S. Menon , Amruta Nori-Sarma , Dorairaj Prabhakaran , Joel Schwartz , Praggya Sharma , Massimo Stafoggia , Gagandeep Kaur Walia , Gregory A. Wellenius , Poornima Prabhakaran , Petter Ljungman , Siddhartha Mandal
{"title":"印度全国空气污染热点分析:PM2.5 时空趋势分析(2008-2019 年)。","authors":"Suganthi Jaganathan , Ajit Rajiva , Heresh Amini , Jeroen de Bont , Shweta Dixit , Anubrati Dutta , Itai Kloog , Kevin J. Lane , Jyothi S. Menon , Amruta Nori-Sarma , Dorairaj Prabhakaran , Joel Schwartz , Praggya Sharma , Massimo Stafoggia , Gagandeep Kaur Walia , Gregory A. Wellenius , Poornima Prabhakaran , Petter Ljungman , Siddhartha Mandal","doi":"10.1016/j.envres.2024.120276","DOIUrl":null,"url":null,"abstract":"<div><h3>Introduction</h3><div>India experiences high levels of air pollution as measured by fine particulate matter <2.5 μm (PM<sub>2.5</sub>) across the country. With limited resources, it is imperative to identify the most impacted areas. We aimed to identify air pollution hotspots in India and analyze temporal trends.</div></div><div><h3>Methods</h3><div>We conducted a geospatial analysis using Getis-Ord Gi statistics on gridded-annual levels of PM<sub>2.5</sub> disaggregated for every state/UT and three largest cities [Delhi, Kolkata & Mumbai] of India from 2008 to 2019. The annual average PM<sub>2.5</sub> was derived from a validated and robust nationwide spatiotemporal model(1kmx1km). Hotspots were identified annually using Gi∗ score and p-value and temporal trends across 2 periods [T1:2008–2013 & T2:2014–2019] for each spatial unit. We classified temporal trends based on the number of occurrences of hotspots in T1 and in T2 as consistent (similar in T1 & T2), declining (decreasing in T2) and emerging (increasing in T2) hotspots.</div></div><div><h3>Results</h3><div>We identified consistent hotspots in 9.9% followed by emerging hotspots in 2.6% of the country where 16% and 4.9% people live. In addition, we identified declining hotspots in 2.6% area with 3.4% of the population. Rajasthan had largest share of area identified as consistent hotspots while Uttar Pradesh had densely populated consistent hotspots. Maharashtra had both higher number of areas identified as emerging and declining hotspots. Among the largest cities, Kolkata had highest proportion of consistent hotspots. We identified 170 additional cities with either consistent or emerging hotspots beyond the non-attainment cities as defined by the National Clean Air Programme.</div></div><div><h3>Conclusion</h3><div>India continues to have large areas of consistent and emerging hotspots of air pollution where close to a fifth of India's population live. Identifying hotspots can inform strategic approach for targeted action in air quality management, appropriate resource allocation and a baseline for assessing intervention effectiveness and future programs and policies, including health.</div></div>","PeriodicalId":312,"journal":{"name":"Environmental Research","volume":"264 ","pages":"Article 120276"},"PeriodicalIF":7.7000,"publicationDate":"2024-11-05","publicationTypes":"Journal Article","fieldsOfStudy":null,"isOpenAccess":false,"openAccessPdf":"","citationCount":"0","resultStr":"{\"title\":\"Nationwide analysis of air pollution hotspots across India: A spatiotemporal PM2.5 trend analysis (2008–2019)\",\"authors\":\"Suganthi Jaganathan , Ajit Rajiva , Heresh Amini , Jeroen de Bont , Shweta Dixit , Anubrati Dutta , Itai Kloog , Kevin J. Lane , Jyothi S. Menon , Amruta Nori-Sarma , Dorairaj Prabhakaran , Joel Schwartz , Praggya Sharma , Massimo Stafoggia , Gagandeep Kaur Walia , Gregory A. Wellenius , Poornima Prabhakaran , Petter Ljungman , Siddhartha Mandal\",\"doi\":\"10.1016/j.envres.2024.120276\",\"DOIUrl\":null,\"url\":null,\"abstract\":\"<div><h3>Introduction</h3><div>India experiences high levels of air pollution as measured by fine particulate matter <2.5 μm (PM<sub>2.5</sub>) across the country. With limited resources, it is imperative to identify the most impacted areas. We aimed to identify air pollution hotspots in India and analyze temporal trends.</div></div><div><h3>Methods</h3><div>We conducted a geospatial analysis using Getis-Ord Gi statistics on gridded-annual levels of PM<sub>2.5</sub> disaggregated for every state/UT and three largest cities [Delhi, Kolkata & Mumbai] of India from 2008 to 2019. The annual average PM<sub>2.5</sub> was derived from a validated and robust nationwide spatiotemporal model(1kmx1km). Hotspots were identified annually using Gi∗ score and p-value and temporal trends across 2 periods [T1:2008–2013 & T2:2014–2019] for each spatial unit. We classified temporal trends based on the number of occurrences of hotspots in T1 and in T2 as consistent (similar in T1 & T2), declining (decreasing in T2) and emerging (increasing in T2) hotspots.</div></div><div><h3>Results</h3><div>We identified consistent hotspots in 9.9% followed by emerging hotspots in 2.6% of the country where 16% and 4.9% people live. In addition, we identified declining hotspots in 2.6% area with 3.4% of the population. Rajasthan had largest share of area identified as consistent hotspots while Uttar Pradesh had densely populated consistent hotspots. Maharashtra had both higher number of areas identified as emerging and declining hotspots. Among the largest cities, Kolkata had highest proportion of consistent hotspots. We identified 170 additional cities with either consistent or emerging hotspots beyond the non-attainment cities as defined by the National Clean Air Programme.</div></div><div><h3>Conclusion</h3><div>India continues to have large areas of consistent and emerging hotspots of air pollution where close to a fifth of India's population live. Identifying hotspots can inform strategic approach for targeted action in air quality management, appropriate resource allocation and a baseline for assessing intervention effectiveness and future programs and policies, including health.</div></div>\",\"PeriodicalId\":312,\"journal\":{\"name\":\"Environmental Research\",\"volume\":\"264 \",\"pages\":\"Article 120276\"},\"PeriodicalIF\":7.7000,\"publicationDate\":\"2024-11-05\",\"publicationTypes\":\"Journal Article\",\"fieldsOfStudy\":null,\"isOpenAccess\":false,\"openAccessPdf\":\"\",\"citationCount\":\"0\",\"resultStr\":null,\"platform\":\"Semanticscholar\",\"paperid\":null,\"PeriodicalName\":\"Environmental Research\",\"FirstCategoryId\":\"93\",\"ListUrlMain\":\"https://www.sciencedirect.com/science/article/pii/S0013935124021832\",\"RegionNum\":2,\"RegionCategory\":\"环境科学与生态学\",\"ArticlePicture\":[],\"TitleCN\":null,\"AbstractTextCN\":null,\"PMCID\":null,\"EPubDate\":\"\",\"PubModel\":\"\",\"JCR\":\"Q1\",\"JCRName\":\"ENVIRONMENTAL SCIENCES\",\"Score\":null,\"Total\":0}","platform":"Semanticscholar","paperid":null,"PeriodicalName":"Environmental Research","FirstCategoryId":"93","ListUrlMain":"https://www.sciencedirect.com/science/article/pii/S0013935124021832","RegionNum":2,"RegionCategory":"环境科学与生态学","ArticlePicture":[],"TitleCN":null,"AbstractTextCN":null,"PMCID":null,"EPubDate":"","PubModel":"","JCR":"Q1","JCRName":"ENVIRONMENTAL SCIENCES","Score":null,"Total":0}
Nationwide analysis of air pollution hotspots across India: A spatiotemporal PM2.5 trend analysis (2008–2019)
Introduction
India experiences high levels of air pollution as measured by fine particulate matter <2.5 μm (PM2.5) across the country. With limited resources, it is imperative to identify the most impacted areas. We aimed to identify air pollution hotspots in India and analyze temporal trends.
Methods
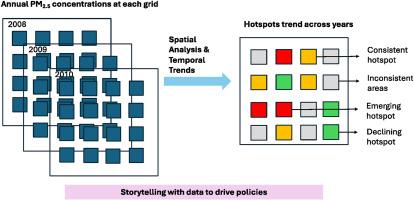
We conducted a geospatial analysis using Getis-Ord Gi statistics on gridded-annual levels of PM2.5 disaggregated for every state/UT and three largest cities [Delhi, Kolkata & Mumbai] of India from 2008 to 2019. The annual average PM2.5 was derived from a validated and robust nationwide spatiotemporal model(1kmx1km). Hotspots were identified annually using Gi∗ score and p-value and temporal trends across 2 periods [T1:2008–2013 & T2:2014–2019] for each spatial unit. We classified temporal trends based on the number of occurrences of hotspots in T1 and in T2 as consistent (similar in T1 & T2), declining (decreasing in T2) and emerging (increasing in T2) hotspots.
Results
We identified consistent hotspots in 9.9% followed by emerging hotspots in 2.6% of the country where 16% and 4.9% people live. In addition, we identified declining hotspots in 2.6% area with 3.4% of the population. Rajasthan had largest share of area identified as consistent hotspots while Uttar Pradesh had densely populated consistent hotspots. Maharashtra had both higher number of areas identified as emerging and declining hotspots. Among the largest cities, Kolkata had highest proportion of consistent hotspots. We identified 170 additional cities with either consistent or emerging hotspots beyond the non-attainment cities as defined by the National Clean Air Programme.
Conclusion
India continues to have large areas of consistent and emerging hotspots of air pollution where close to a fifth of India's population live. Identifying hotspots can inform strategic approach for targeted action in air quality management, appropriate resource allocation and a baseline for assessing intervention effectiveness and future programs and policies, including health.
期刊介绍:
The Environmental Research journal presents a broad range of interdisciplinary research, focused on addressing worldwide environmental concerns and featuring innovative findings. Our publication strives to explore relevant anthropogenic issues across various environmental sectors, showcasing practical applications in real-life settings.