{"title":"利用归一化差异红边指数跟踪红树林的光利用效率","authors":"Yanjie Liu , Xudong Zhu","doi":"10.1016/j.ecolind.2024.112774","DOIUrl":null,"url":null,"abstract":"<div><div>Strong temporal and spatial heterogeneity of mangrove carbon fluxes makes it difficult to accurately assess mangrove carbon budgets at both site and regional scales. The light use efficiency (LUE) model provides a promising remote sensing approach, however, the lack of robust spectral metrics for tracking mangrove LUE hinders the integration of carbon flux and remote sensing measurements. To close this gap, here we examined the potential of six relevant spectral metrics, including red edge position, red edge reflectance, red valley reflectance, green peak reflectance, normalized difference vegetation index, and normalized difference red edge index (NDRE), for tracking canopy LUE based on two-year (2021–2022) simultaneous measurements of tower-based hyperspectral and eddy covariance (EC) data in a subtropical mangrove of southeastern China. The results indicated that mangrove LUE had strong daily and seasonal variations with the value down-regulated by increasing vapor pressure deficit (VPD) and air temperature. The canopy spectral reflectance curve changed seasonally showing elevated reflectance with increasing VPD over the entire visible/red-edge bands. Among the spectral metrics, NDRE was found to be the only statistically significant correlated to LUE at both daily and monthly scales, showing a positive and linear NDRE-LUE linkage. To the best of our knowledge, this is the first study to explore the links between mangrove LUE and red edge-related spectral metrics across temporal scales using simultaneous hyperspectral and EC measurements. The NDRE-LUE linkage confirmed here provides a basis for establishing robust remote sensing approaches to map mangrove LUE and carbon fluxes with ready-available satellite data.</div></div>","PeriodicalId":11459,"journal":{"name":"Ecological Indicators","volume":"168 ","pages":"Article 112774"},"PeriodicalIF":7.0000,"publicationDate":"2024-11-01","publicationTypes":"Journal Article","fieldsOfStudy":null,"isOpenAccess":false,"openAccessPdf":"","citationCount":"0","resultStr":"{\"title\":\"Tracking mangrove light use efficiency using normalized difference red edge index\",\"authors\":\"Yanjie Liu , Xudong Zhu\",\"doi\":\"10.1016/j.ecolind.2024.112774\",\"DOIUrl\":null,\"url\":null,\"abstract\":\"<div><div>Strong temporal and spatial heterogeneity of mangrove carbon fluxes makes it difficult to accurately assess mangrove carbon budgets at both site and regional scales. The light use efficiency (LUE) model provides a promising remote sensing approach, however, the lack of robust spectral metrics for tracking mangrove LUE hinders the integration of carbon flux and remote sensing measurements. To close this gap, here we examined the potential of six relevant spectral metrics, including red edge position, red edge reflectance, red valley reflectance, green peak reflectance, normalized difference vegetation index, and normalized difference red edge index (NDRE), for tracking canopy LUE based on two-year (2021–2022) simultaneous measurements of tower-based hyperspectral and eddy covariance (EC) data in a subtropical mangrove of southeastern China. The results indicated that mangrove LUE had strong daily and seasonal variations with the value down-regulated by increasing vapor pressure deficit (VPD) and air temperature. The canopy spectral reflectance curve changed seasonally showing elevated reflectance with increasing VPD over the entire visible/red-edge bands. Among the spectral metrics, NDRE was found to be the only statistically significant correlated to LUE at both daily and monthly scales, showing a positive and linear NDRE-LUE linkage. To the best of our knowledge, this is the first study to explore the links between mangrove LUE and red edge-related spectral metrics across temporal scales using simultaneous hyperspectral and EC measurements. The NDRE-LUE linkage confirmed here provides a basis for establishing robust remote sensing approaches to map mangrove LUE and carbon fluxes with ready-available satellite data.</div></div>\",\"PeriodicalId\":11459,\"journal\":{\"name\":\"Ecological Indicators\",\"volume\":\"168 \",\"pages\":\"Article 112774\"},\"PeriodicalIF\":7.0000,\"publicationDate\":\"2024-11-01\",\"publicationTypes\":\"Journal Article\",\"fieldsOfStudy\":null,\"isOpenAccess\":false,\"openAccessPdf\":\"\",\"citationCount\":\"0\",\"resultStr\":null,\"platform\":\"Semanticscholar\",\"paperid\":null,\"PeriodicalName\":\"Ecological Indicators\",\"FirstCategoryId\":\"93\",\"ListUrlMain\":\"https://www.sciencedirect.com/science/article/pii/S1470160X24012317\",\"RegionNum\":2,\"RegionCategory\":\"环境科学与生态学\",\"ArticlePicture\":[],\"TitleCN\":null,\"AbstractTextCN\":null,\"PMCID\":null,\"EPubDate\":\"\",\"PubModel\":\"\",\"JCR\":\"Q1\",\"JCRName\":\"ENVIRONMENTAL SCIENCES\",\"Score\":null,\"Total\":0}","platform":"Semanticscholar","paperid":null,"PeriodicalName":"Ecological Indicators","FirstCategoryId":"93","ListUrlMain":"https://www.sciencedirect.com/science/article/pii/S1470160X24012317","RegionNum":2,"RegionCategory":"环境科学与生态学","ArticlePicture":[],"TitleCN":null,"AbstractTextCN":null,"PMCID":null,"EPubDate":"","PubModel":"","JCR":"Q1","JCRName":"ENVIRONMENTAL SCIENCES","Score":null,"Total":0}
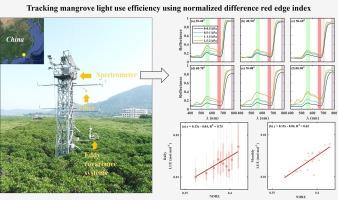
Tracking mangrove light use efficiency using normalized difference red edge index
Strong temporal and spatial heterogeneity of mangrove carbon fluxes makes it difficult to accurately assess mangrove carbon budgets at both site and regional scales. The light use efficiency (LUE) model provides a promising remote sensing approach, however, the lack of robust spectral metrics for tracking mangrove LUE hinders the integration of carbon flux and remote sensing measurements. To close this gap, here we examined the potential of six relevant spectral metrics, including red edge position, red edge reflectance, red valley reflectance, green peak reflectance, normalized difference vegetation index, and normalized difference red edge index (NDRE), for tracking canopy LUE based on two-year (2021–2022) simultaneous measurements of tower-based hyperspectral and eddy covariance (EC) data in a subtropical mangrove of southeastern China. The results indicated that mangrove LUE had strong daily and seasonal variations with the value down-regulated by increasing vapor pressure deficit (VPD) and air temperature. The canopy spectral reflectance curve changed seasonally showing elevated reflectance with increasing VPD over the entire visible/red-edge bands. Among the spectral metrics, NDRE was found to be the only statistically significant correlated to LUE at both daily and monthly scales, showing a positive and linear NDRE-LUE linkage. To the best of our knowledge, this is the first study to explore the links between mangrove LUE and red edge-related spectral metrics across temporal scales using simultaneous hyperspectral and EC measurements. The NDRE-LUE linkage confirmed here provides a basis for establishing robust remote sensing approaches to map mangrove LUE and carbon fluxes with ready-available satellite data.
期刊介绍:
The ultimate aim of Ecological Indicators is to integrate the monitoring and assessment of ecological and environmental indicators with management practices. The journal provides a forum for the discussion of the applied scientific development and review of traditional indicator approaches as well as for theoretical, modelling and quantitative applications such as index development. Research into the following areas will be published.
• All aspects of ecological and environmental indicators and indices.
• New indicators, and new approaches and methods for indicator development, testing and use.
• Development and modelling of indices, e.g. application of indicator suites across multiple scales and resources.
• Analysis and research of resource, system- and scale-specific indicators.
• Methods for integration of social and other valuation metrics for the production of scientifically rigorous and politically-relevant assessments using indicator-based monitoring and assessment programs.
• How research indicators can be transformed into direct application for management purposes.
• Broader assessment objectives and methods, e.g. biodiversity, biological integrity, and sustainability, through the use of indicators.
• Resource-specific indicators such as landscape, agroecosystems, forests, wetlands, etc.