Ashley Tubbs, Junaid U. Ahmed, Jayani Christopher and Julio C. Alvarez
{"title":"萨维茨基-戈莱处理和二维绘制随机阻断电化学的电流-时间信号,以分析杆状细菌混合物。","authors":"Ashley Tubbs, Junaid U. Ahmed, Jayani Christopher and Julio C. Alvarez","doi":"10.1039/D4AY00899E","DOIUrl":null,"url":null,"abstract":"<p >In stochastic blocking electrochemistry, adsorptive collisions of nano and micro-particles with an ultramicroelectrode (UME) generate steps of decreasing current overlaid on the current–time (<em>i</em>–<em>t</em>) baseline of an electroactive mediator reacting at the UME. The step amplitude (Δ<em>i</em>) induced by particle blockage informs about its size, while collision frequency correlates with particle transport. However, because most particles arrive at the UME faster than the acquisition speed of conventional electrochemical instruments, current steps appear vertical. Recently, when analyzing rod-shape bacteria (bacilli), we detected slanted steps of duration Δ<em>t</em> (∼0.6 to 1.1 s) that were found to scale up with bacillus length (∼1 to 5 μm, respectively). In this work, we apply a Savitzky–Golay (SG) algorithm coded in MATLAB to convert experimental <em>i</em>–<em>t</em> recordings into derivative plots of Δ<em>i</em>/Δ<em>t versus t</em>. As a result, current steps become peaks on a flat baseline. Unlike the original values of Δ<em>i</em> and Δ<em>t</em> that require manual gauging, the coded SG-algorithm generates both parameters automatically from peak integration. We then display Δ<em>i</em> and Δ<em>t</em> in bidimensional scatter plots comparing mixtures of <em>A. erythreum</em> (∼1 μm) and <em>B. subtilis</em> (∼5 μm). The spread of Δ<em>i</em> and Δ<em>t</em> values complies with the size distribution observed using scanning electron microscopy. By introducing SG-processing and bidimensional plotting of <em>i</em>–<em>t</em> recordings from stochastic blocking data we broaden the scope of the technique. The approach facilitates distinguishing bacilli in mixtures because both Δ<em>t</em> and Δ<em>i</em> increase with bacillus length and now they can be displayed in a single graph along with adsorption frequency. Moreover, density distribution and proportion of data points from groups of bacteria are also discernible from the plots.</p>","PeriodicalId":64,"journal":{"name":"Analytical Methods","volume":" 38","pages":" 6570-6576"},"PeriodicalIF":2.6000,"publicationDate":"2024-09-02","publicationTypes":"Journal Article","fieldsOfStudy":null,"isOpenAccess":false,"openAccessPdf":"https://pubs.rsc.org/en/content/articlepdf/2024/ay/d4ay00899e?page=search","citationCount":"0","resultStr":"{\"title\":\"Savitzky–Golay processing and bidimensional plotting of current–time signals from stochastic blocking electrochemistry to analyze mixtures of rod-shaped bacteria†\",\"authors\":\"Ashley Tubbs, Junaid U. Ahmed, Jayani Christopher and Julio C. Alvarez\",\"doi\":\"10.1039/D4AY00899E\",\"DOIUrl\":null,\"url\":null,\"abstract\":\"<p >In stochastic blocking electrochemistry, adsorptive collisions of nano and micro-particles with an ultramicroelectrode (UME) generate steps of decreasing current overlaid on the current–time (<em>i</em>–<em>t</em>) baseline of an electroactive mediator reacting at the UME. The step amplitude (Δ<em>i</em>) induced by particle blockage informs about its size, while collision frequency correlates with particle transport. However, because most particles arrive at the UME faster than the acquisition speed of conventional electrochemical instruments, current steps appear vertical. Recently, when analyzing rod-shape bacteria (bacilli), we detected slanted steps of duration Δ<em>t</em> (∼0.6 to 1.1 s) that were found to scale up with bacillus length (∼1 to 5 μm, respectively). In this work, we apply a Savitzky–Golay (SG) algorithm coded in MATLAB to convert experimental <em>i</em>–<em>t</em> recordings into derivative plots of Δ<em>i</em>/Δ<em>t versus t</em>. As a result, current steps become peaks on a flat baseline. Unlike the original values of Δ<em>i</em> and Δ<em>t</em> that require manual gauging, the coded SG-algorithm generates both parameters automatically from peak integration. We then display Δ<em>i</em> and Δ<em>t</em> in bidimensional scatter plots comparing mixtures of <em>A. erythreum</em> (∼1 μm) and <em>B. subtilis</em> (∼5 μm). The spread of Δ<em>i</em> and Δ<em>t</em> values complies with the size distribution observed using scanning electron microscopy. By introducing SG-processing and bidimensional plotting of <em>i</em>–<em>t</em> recordings from stochastic blocking data we broaden the scope of the technique. The approach facilitates distinguishing bacilli in mixtures because both Δ<em>t</em> and Δ<em>i</em> increase with bacillus length and now they can be displayed in a single graph along with adsorption frequency. Moreover, density distribution and proportion of data points from groups of bacteria are also discernible from the plots.</p>\",\"PeriodicalId\":64,\"journal\":{\"name\":\"Analytical Methods\",\"volume\":\" 38\",\"pages\":\" 6570-6576\"},\"PeriodicalIF\":2.6000,\"publicationDate\":\"2024-09-02\",\"publicationTypes\":\"Journal Article\",\"fieldsOfStudy\":null,\"isOpenAccess\":false,\"openAccessPdf\":\"https://pubs.rsc.org/en/content/articlepdf/2024/ay/d4ay00899e?page=search\",\"citationCount\":\"0\",\"resultStr\":null,\"platform\":\"Semanticscholar\",\"paperid\":null,\"PeriodicalName\":\"Analytical Methods\",\"FirstCategoryId\":\"92\",\"ListUrlMain\":\"https://pubs.rsc.org/en/content/articlelanding/2024/ay/d4ay00899e\",\"RegionNum\":3,\"RegionCategory\":\"化学\",\"ArticlePicture\":[],\"TitleCN\":null,\"AbstractTextCN\":null,\"PMCID\":null,\"EPubDate\":\"\",\"PubModel\":\"\",\"JCR\":\"Q2\",\"JCRName\":\"CHEMISTRY, ANALYTICAL\",\"Score\":null,\"Total\":0}","platform":"Semanticscholar","paperid":null,"PeriodicalName":"Analytical Methods","FirstCategoryId":"92","ListUrlMain":"https://pubs.rsc.org/en/content/articlelanding/2024/ay/d4ay00899e","RegionNum":3,"RegionCategory":"化学","ArticlePicture":[],"TitleCN":null,"AbstractTextCN":null,"PMCID":null,"EPubDate":"","PubModel":"","JCR":"Q2","JCRName":"CHEMISTRY, ANALYTICAL","Score":null,"Total":0}
Savitzky–Golay processing and bidimensional plotting of current–time signals from stochastic blocking electrochemistry to analyze mixtures of rod-shaped bacteria†
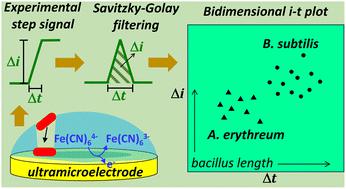
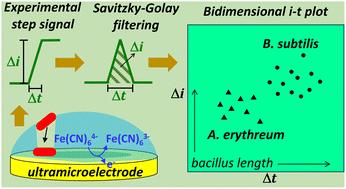
In stochastic blocking electrochemistry, adsorptive collisions of nano and micro-particles with an ultramicroelectrode (UME) generate steps of decreasing current overlaid on the current–time (i–t) baseline of an electroactive mediator reacting at the UME. The step amplitude (Δi) induced by particle blockage informs about its size, while collision frequency correlates with particle transport. However, because most particles arrive at the UME faster than the acquisition speed of conventional electrochemical instruments, current steps appear vertical. Recently, when analyzing rod-shape bacteria (bacilli), we detected slanted steps of duration Δt (∼0.6 to 1.1 s) that were found to scale up with bacillus length (∼1 to 5 μm, respectively). In this work, we apply a Savitzky–Golay (SG) algorithm coded in MATLAB to convert experimental i–t recordings into derivative plots of Δi/Δt versus t. As a result, current steps become peaks on a flat baseline. Unlike the original values of Δi and Δt that require manual gauging, the coded SG-algorithm generates both parameters automatically from peak integration. We then display Δi and Δt in bidimensional scatter plots comparing mixtures of A. erythreum (∼1 μm) and B. subtilis (∼5 μm). The spread of Δi and Δt values complies with the size distribution observed using scanning electron microscopy. By introducing SG-processing and bidimensional plotting of i–t recordings from stochastic blocking data we broaden the scope of the technique. The approach facilitates distinguishing bacilli in mixtures because both Δt and Δi increase with bacillus length and now they can be displayed in a single graph along with adsorption frequency. Moreover, density distribution and proportion of data points from groups of bacteria are also discernible from the plots.
 求助内容:
求助内容: 应助结果提醒方式:


