甘油三酯-葡萄糖指数及其与脂肪相关指数的组合与心肌梗死发病率的关系:英国生物库队列研究。
IF 4.2
2区 医学
Q1 ENDOCRINOLOGY & METABOLISM
引用次数: 0
摘要
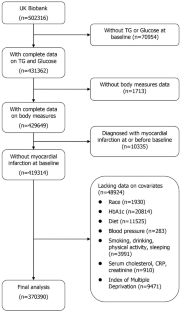
背景:甘油三酯-葡萄糖(TyG)指数与腰围(WC)、体重指数(BMI)和腰围-身高比(WHtR)相结合时,比单独使用时更能反映胰岛素抵抗。本研究旨在前瞻性地检测TyG、TyG-BMI、TyG-WC和TyG-WHtR与心肌梗死(MI)发病率及其亚型之间的关系:这项队列研究包括英国生物库中的 370,390 名参与者。采用Cox比例危险模型和限制性立方样条回归模型评估TyG、TyG-BMI、TyG-WC和TyG-WHtR与心肌梗死、ST段抬高型心肌梗死(STEMI)和非ST段抬高型心肌梗死(NSTEMI)的关系。采用接收者操作特征曲线(ROC)和曲线下面积(AUC)来检验四项指标的预测价值:在完全调整模型中,TyG、TyG-BMI、TyG-WC 和 TyG-WHtR 在最高四分位数的心肌梗死危险比 (HR) 和 95% 置信区间 (CI) 分别为 1.36 (1.28-1.44)、1.47 (1.39-1.56)、1.53 (1.43-1.64) 和 1.58 (1.48-1.68)。当结果被重新分类为 STEMI 或 NSTEMI 时,也观察到了类似的结果。然而,TyG-BMI、TyG-WC 和 TyG-WHtR 与 STEMI 风险的相关性弱于 MI 和 NSTEMI。TyG与MI和NSTEMI风险之间呈线性剂量反应关系。TyG-BMI、TyG-WC和TyG-WHtR与心肌梗死、STEMI和NSTEMI风险的关系均呈非线性模式。TyG-WC在诊断MI(AUC:0.648,95% CI:0.644-0.653)、STEMI(AUC:0.631,95% CI:0.622-0.639)和NSTEMI(AUC:0.647,95% CI:0.641-0.654)方面最为有效:结论:TyG指数与心肌梗死和NSTEMI风险增加呈线性相关,而TyG-BMI、TyG-WC和TyG-WHtR与心肌梗死和NSTEMI风险增加呈非线性相关。这些指标与 STEMI 的关系有明显的模式。TyG-WC对MI、STEMI和NSTEMI的诊断效果最佳。本文章由计算机程序翻译,如有差异,请以英文原文为准。

Association of triglyceride-glucose index and its combination with adiposity-related indices with the incidence of myocardial infarction: a cohort study from the UK Biobank
The triglyceride-glucose (TyG) index performs better at reflecting insulin resistance when combined with waist circumference (WC), body mass index (BMI), and waist-to-height ratio (WHtR) than when used alone. This study aimed to prospectively examine the relationships between TyG, TyG-BMI, TyG-WC, and TyG-WHtR with the incidence of myocardial infarction (MI) and its subtypes. This cohort study included 370,390 participants from the UK Biobank. The Cox proportional hazards model and restricted cubic spline regression model were used to assess the associations of TyG, TyG-BMI, TyG-WC, and TyG-WHtR with MI, ST-elevation MI (STEMI) and non-ST-elevation MI (NSTEMI). The receiver operating characteristic (ROC) curve and the area under the curve (AUC) were employed to examine the predictive value of four indicators. The hazard ratios (HRs) and 95% confidence intervals (CIs) of MI in the highest quartiles for TyG, TyG-BMI, TyG-WC, and TyG-WHtR were 1.36 (1.28–1.44), 1.47 (1.39–1.56), 1.53 (1.43–1.64), and 1.58 (1.48–1.68) in the fully-adjusted model. Comparable findings were observed when the outcomes were reclassified as STEMI or NSTEMI. However, the associations of TyG-BMI, TyG-WC, and TyG-WHtR with the risk of STEMI were weaker than MI and NSTEMI. A linear dose-response association between TyG and the risk of MI and NSTEMI were demonstrated. TyG-BMI, TyG-WC, and TyG-WHtR all showed nonlinear patterns in their associations with the risk of MI, STEMI, and NSTEMI. TyG-WC was most effective in diagnosing MI (AUC: 0.648, 95% CI: 0.644–0.653), STEMI (AUC: 0.631, 95% CI: 0.622–0.639), and NSTEMI (AUC: 0.647, 95% CI: 0.641–0.654). The TyG index was linearly associated with increased risk of MI and NSTEMI, whereas TyG-BMI, TyG-WC, and TyG-WHtR were nonlinearly associated with increased risk of MI and NSTEMI. There were distinct patterns in the relationships between these indicators with STEMI. TyG-WC provided the best diagnostic effectiveness for MI, STEMI, and NSTEMI.
求助全文
通过发布文献求助,成功后即可免费获取论文全文。
去求助
来源期刊
International Journal of Obesity
医学-内分泌学与代谢
CiteScore
10.00
自引率
2.00%
发文量
221
审稿时长
3 months
期刊介绍:
The International Journal of Obesity is a multi-disciplinary forum for research describing basic, clinical and applied studies in biochemistry, physiology, genetics and nutrition, molecular, metabolic, psychological and epidemiological aspects of obesity and related disorders.
We publish a range of content types including original research articles, technical reports, reviews, correspondence and brief communications that elaborate on significant advances in the field and cover topical issues.
 求助内容:
求助内容: 应助结果提醒方式:


