Zheng Fu, Philippe Ciais, Jean-Pierre Wigneron, Pierre Gentine, Andrew F. Feldman, David Makowski, Nicolas Viovy, Armen R. Kemanian, Daniel S. Goll, Paul C. Stoy, Iain Colin Prentice, Dan Yakir, Liyang Liu, Hongliang Ma, Xiaojun Li, Yuanyuan Huang, Kailiang Yu, Peng Zhu, Xing Li, Zaichun Zhu, Jinghui Lian, William K. Smith
{"title":"植物水分胁迫的全球临界土壤水分阈值","authors":"Zheng Fu, Philippe Ciais, Jean-Pierre Wigneron, Pierre Gentine, Andrew F. Feldman, David Makowski, Nicolas Viovy, Armen R. Kemanian, Daniel S. Goll, Paul C. Stoy, Iain Colin Prentice, Dan Yakir, Liyang Liu, Hongliang Ma, Xiaojun Li, Yuanyuan Huang, Kailiang Yu, Peng Zhu, Xing Li, Zaichun Zhu, Jinghui Lian, William K. Smith","doi":"10.1038/s41467-024-49244-7","DOIUrl":null,"url":null,"abstract":"<p>During extensive periods without rain, known as dry-downs, decreasing soil moisture (SM) induces plant water stress at the point when it limits evapotranspiration, defining a critical SM threshold (θ<sub>crit</sub>). Better quantification of θ<sub>crit</sub> is needed for improving future projections of climate and water resources, food production, and ecosystem vulnerability. Here, we combine systematic satellite observations of the diurnal amplitude of land surface temperature (dLST) and SM during dry-downs, corroborated by in-situ data from flux towers, to generate the observation-based global map of θ<sub>crit</sub>. We find an average global θ<sub>crit</sub> of 0.19 m<sup>3</sup>/m<sup>3</sup>, varying from 0.12 m<sup>3</sup>/m<sup>3</sup> in arid ecosystems to 0.26 m<sup>3</sup>/m<sup>3</sup> in humid ecosystems. θ<sub>crit</sub> simulated by Earth System Models is overestimated in dry areas and underestimated in wet areas. The global observed pattern of θ<sub>crit</sub> reflects plant adaptation to soil available water and atmospheric demand. Using explainable machine learning, we show that aridity index, leaf area and soil texture are the most influential drivers. Moreover, we show that the annual fraction of days with water stress, when SM stays below θ<sub>crit</sub>, has increased in the past four decades. Our results have important implications for understanding the inception of water stress in models and identifying SM tipping points.</p>","PeriodicalId":19066,"journal":{"name":"Nature Communications","volume":"313 1","pages":""},"PeriodicalIF":14.7000,"publicationDate":"2024-06-06","publicationTypes":"Journal Article","fieldsOfStudy":null,"isOpenAccess":false,"openAccessPdf":"","citationCount":"0","resultStr":"{\"title\":\"Global critical soil moisture thresholds of plant water stress\",\"authors\":\"Zheng Fu, Philippe Ciais, Jean-Pierre Wigneron, Pierre Gentine, Andrew F. Feldman, David Makowski, Nicolas Viovy, Armen R. Kemanian, Daniel S. Goll, Paul C. Stoy, Iain Colin Prentice, Dan Yakir, Liyang Liu, Hongliang Ma, Xiaojun Li, Yuanyuan Huang, Kailiang Yu, Peng Zhu, Xing Li, Zaichun Zhu, Jinghui Lian, William K. Smith\",\"doi\":\"10.1038/s41467-024-49244-7\",\"DOIUrl\":null,\"url\":null,\"abstract\":\"<p>During extensive periods without rain, known as dry-downs, decreasing soil moisture (SM) induces plant water stress at the point when it limits evapotranspiration, defining a critical SM threshold (θ<sub>crit</sub>). Better quantification of θ<sub>crit</sub> is needed for improving future projections of climate and water resources, food production, and ecosystem vulnerability. Here, we combine systematic satellite observations of the diurnal amplitude of land surface temperature (dLST) and SM during dry-downs, corroborated by in-situ data from flux towers, to generate the observation-based global map of θ<sub>crit</sub>. We find an average global θ<sub>crit</sub> of 0.19 m<sup>3</sup>/m<sup>3</sup>, varying from 0.12 m<sup>3</sup>/m<sup>3</sup> in arid ecosystems to 0.26 m<sup>3</sup>/m<sup>3</sup> in humid ecosystems. θ<sub>crit</sub> simulated by Earth System Models is overestimated in dry areas and underestimated in wet areas. The global observed pattern of θ<sub>crit</sub> reflects plant adaptation to soil available water and atmospheric demand. Using explainable machine learning, we show that aridity index, leaf area and soil texture are the most influential drivers. Moreover, we show that the annual fraction of days with water stress, when SM stays below θ<sub>crit</sub>, has increased in the past four decades. Our results have important implications for understanding the inception of water stress in models and identifying SM tipping points.</p>\",\"PeriodicalId\":19066,\"journal\":{\"name\":\"Nature Communications\",\"volume\":\"313 1\",\"pages\":\"\"},\"PeriodicalIF\":14.7000,\"publicationDate\":\"2024-06-06\",\"publicationTypes\":\"Journal Article\",\"fieldsOfStudy\":null,\"isOpenAccess\":false,\"openAccessPdf\":\"\",\"citationCount\":\"0\",\"resultStr\":null,\"platform\":\"Semanticscholar\",\"paperid\":null,\"PeriodicalName\":\"Nature Communications\",\"FirstCategoryId\":\"103\",\"ListUrlMain\":\"https://doi.org/10.1038/s41467-024-49244-7\",\"RegionNum\":1,\"RegionCategory\":\"综合性期刊\",\"ArticlePicture\":[],\"TitleCN\":null,\"AbstractTextCN\":null,\"PMCID\":null,\"EPubDate\":\"\",\"PubModel\":\"\",\"JCR\":\"Q1\",\"JCRName\":\"MULTIDISCIPLINARY SCIENCES\",\"Score\":null,\"Total\":0}","platform":"Semanticscholar","paperid":null,"PeriodicalName":"Nature Communications","FirstCategoryId":"103","ListUrlMain":"https://doi.org/10.1038/s41467-024-49244-7","RegionNum":1,"RegionCategory":"综合性期刊","ArticlePicture":[],"TitleCN":null,"AbstractTextCN":null,"PMCID":null,"EPubDate":"","PubModel":"","JCR":"Q1","JCRName":"MULTIDISCIPLINARY SCIENCES","Score":null,"Total":0}
引用次数: 0
摘要
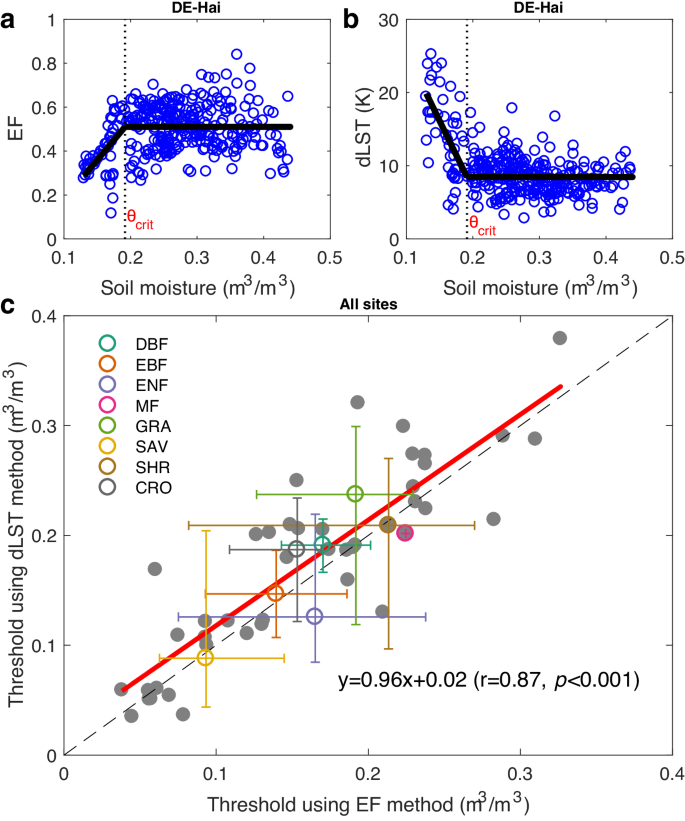
在大范围无雨期间,即所谓的干旱期,土壤湿度(SM)下降会在限制蒸散时引起植物水分胁迫,从而确定临界 SM 临界值(θcrit)。需要更好地量化θcrit,以改进对未来气候和水资源、粮食生产和生态系统脆弱性的预测。在此,我们结合对旱季陆地表面温度(dLST)和SM昼夜振幅的系统卫星观测,并通过通量塔的现场数据加以证实,生成了基于观测的全球θcrit地图。我们发现,全球平均θcrit 为 0.19 立方米/立方米,从干旱生态系统的 0.12 立方米/立方米到湿润生态系统的 0.26 立方米/立方米不等。全球观测到的θcrit模式反映了植物对土壤可用水量和大气需求的适应性。通过可解释的机器学习,我们发现干旱指数、叶面积和土壤质地是最有影响力的驱动因素。此外,我们还表明,在过去 40 年中,当 SM 保持在 θcrit 以下时,每年出现水分胁迫的天数比例在增加。我们的研究结果对于理解模型中水胁迫的起因和识别 SM 临界点具有重要意义。
Global critical soil moisture thresholds of plant water stress
During extensive periods without rain, known as dry-downs, decreasing soil moisture (SM) induces plant water stress at the point when it limits evapotranspiration, defining a critical SM threshold (θcrit). Better quantification of θcrit is needed for improving future projections of climate and water resources, food production, and ecosystem vulnerability. Here, we combine systematic satellite observations of the diurnal amplitude of land surface temperature (dLST) and SM during dry-downs, corroborated by in-situ data from flux towers, to generate the observation-based global map of θcrit. We find an average global θcrit of 0.19 m3/m3, varying from 0.12 m3/m3 in arid ecosystems to 0.26 m3/m3 in humid ecosystems. θcrit simulated by Earth System Models is overestimated in dry areas and underestimated in wet areas. The global observed pattern of θcrit reflects plant adaptation to soil available water and atmospheric demand. Using explainable machine learning, we show that aridity index, leaf area and soil texture are the most influential drivers. Moreover, we show that the annual fraction of days with water stress, when SM stays below θcrit, has increased in the past four decades. Our results have important implications for understanding the inception of water stress in models and identifying SM tipping points.
期刊介绍:
Nature Communications, an open-access journal, publishes high-quality research spanning all areas of the natural sciences. Papers featured in the journal showcase significant advances relevant to specialists in each respective field. With a 2-year impact factor of 16.6 (2022) and a median time of 8 days from submission to the first editorial decision, Nature Communications is committed to rapid dissemination of research findings. As a multidisciplinary journal, it welcomes contributions from biological, health, physical, chemical, Earth, social, mathematical, applied, and engineering sciences, aiming to highlight important breakthroughs within each domain.

 求助内容:
求助内容: 应助结果提醒方式:


