2000 年以来格陵兰岛年最小积雪/冰面积变化:冰原、周边地区以及与冰质量平衡的关系

IF 6.9 1区 地球科学 Q1 METEOROLOGY & ATMOSPHERIC SCIENCES
Alexander P. Trishchenko, Calin Ungureanu
{"title":"2000 年以来格陵兰岛年最小积雪/冰面积变化:冰原、周边地区以及与冰质量平衡的关系","authors":"Alexander P. Trishchenko, Calin Ungureanu","doi":"10.1175/bams-d-22-0244.1","DOIUrl":null,"url":null,"abstract":"Abstract A novel satellite image processing technique was utilized to produce an annual time series of the Minimum Snow/Ice (MSI) extent over the entire Greenland landmass for the period 2000-2022. The information was derived from the Moderate Resolution Imaging Spectroradiometer 10-day clear-sky composites over the April-September period. The data products were generated from 250-m swath imagery. The annual aggregates were downscaled to a 150-m grid for consistency with data on margins of Greenland available from the Geological Survey of Denmark and Greenland (GEUS), and the Greenland Ice Mapping Project. Inter-annual variations in the MSI extent were derived and analyzed for each of the seven major glacier basins in Greenland split into the main ice sheet, represented by a static map, and the peripheral areas from which all variations originated. Four of the seven regions demonstrated statistically significant negative trends in the MSI extent. The entire Greenland area also showed a declining snow/ice extent although this was not statistically significant. The region-wide and peripheral snow/ice extent varied from a minimum of 1.807 × 106 km2 (1.449 × 105 km2 for peripheral areas) observed in 2012 to a maximum of 1.860 × 106 km2 (1.977 × 105 km2) observed in 2006 with an average value of 1.829 × 106 km2 (1.664 × 105 km2). The derived MSI variations showed statistically significant correlation with the near-surface 2- m air temperature from the ERA5 Land reanalysis and Greenland ice mass balance from GEUS for all catchments, with correlation coefficients for the entire area equal to −0.74 and 0.53, respectively. The mapping of many peripheral glaciers and ice shelves included in the glaciology databases and utilized for the IPCC reporting is not always consistent with our results and requires improvement, especially in the coastal areas.","PeriodicalId":9464,"journal":{"name":"Bulletin of the American Meteorological Society","volume":"75 1","pages":""},"PeriodicalIF":6.9000,"publicationDate":"2024-06-03","publicationTypes":"Journal Article","fieldsOfStudy":null,"isOpenAccess":false,"openAccessPdf":"","citationCount":"0","resultStr":"{\"title\":\"Annual Minimum Snow/Ice Extent Variations over Greenland since 2000: Ice Sheet, Peripheral Areas, and Relation to Ice Mass Balance\",\"authors\":\"Alexander P. Trishchenko, Calin Ungureanu\",\"doi\":\"10.1175/bams-d-22-0244.1\",\"DOIUrl\":null,\"url\":null,\"abstract\":\"Abstract A novel satellite image processing technique was utilized to produce an annual time series of the Minimum Snow/Ice (MSI) extent over the entire Greenland landmass for the period 2000-2022. The information was derived from the Moderate Resolution Imaging Spectroradiometer 10-day clear-sky composites over the April-September period. The data products were generated from 250-m swath imagery. The annual aggregates were downscaled to a 150-m grid for consistency with data on margins of Greenland available from the Geological Survey of Denmark and Greenland (GEUS), and the Greenland Ice Mapping Project. Inter-annual variations in the MSI extent were derived and analyzed for each of the seven major glacier basins in Greenland split into the main ice sheet, represented by a static map, and the peripheral areas from which all variations originated. Four of the seven regions demonstrated statistically significant negative trends in the MSI extent. The entire Greenland area also showed a declining snow/ice extent although this was not statistically significant. The region-wide and peripheral snow/ice extent varied from a minimum of 1.807 × 106 km2 (1.449 × 105 km2 for peripheral areas) observed in 2012 to a maximum of 1.860 × 106 km2 (1.977 × 105 km2) observed in 2006 with an average value of 1.829 × 106 km2 (1.664 × 105 km2). The derived MSI variations showed statistically significant correlation with the near-surface 2- m air temperature from the ERA5 Land reanalysis and Greenland ice mass balance from GEUS for all catchments, with correlation coefficients for the entire area equal to −0.74 and 0.53, respectively. The mapping of many peripheral glaciers and ice shelves included in the glaciology databases and utilized for the IPCC reporting is not always consistent with our results and requires improvement, especially in the coastal areas.\",\"PeriodicalId\":9464,\"journal\":{\"name\":\"Bulletin of the American Meteorological Society\",\"volume\":\"75 1\",\"pages\":\"\"},\"PeriodicalIF\":6.9000,\"publicationDate\":\"2024-06-03\",\"publicationTypes\":\"Journal Article\",\"fieldsOfStudy\":null,\"isOpenAccess\":false,\"openAccessPdf\":\"\",\"citationCount\":\"0\",\"resultStr\":null,\"platform\":\"Semanticscholar\",\"paperid\":null,\"PeriodicalName\":\"Bulletin of the American Meteorological Society\",\"FirstCategoryId\":\"89\",\"ListUrlMain\":\"https://doi.org/10.1175/bams-d-22-0244.1\",\"RegionNum\":1,\"RegionCategory\":\"地球科学\",\"ArticlePicture\":[],\"TitleCN\":null,\"AbstractTextCN\":null,\"PMCID\":null,\"EPubDate\":\"\",\"PubModel\":\"\",\"JCR\":\"Q1\",\"JCRName\":\"METEOROLOGY & ATMOSPHERIC SCIENCES\",\"Score\":null,\"Total\":0}","platform":"Semanticscholar","paperid":null,"PeriodicalName":"Bulletin of the American Meteorological Society","FirstCategoryId":"89","ListUrlMain":"https://doi.org/10.1175/bams-d-22-0244.1","RegionNum":1,"RegionCategory":"地球科学","ArticlePicture":[],"TitleCN":null,"AbstractTextCN":null,"PMCID":null,"EPubDate":"","PubModel":"","JCR":"Q1","JCRName":"METEOROLOGY & ATMOSPHERIC SCIENCES","Score":null,"Total":0}
引用次数: 0

摘要

摘要 利用一种新颖的卫星图像处理技术,制作了 2000-2022 年期间整个格陵兰陆地最小积雪/结冰(MSI)范围的年度时间序列。这些信息来自中分辨率成像分光仪 4 月至 9 月期间的 10 天晴空合成图。数据产品由 250 米扫描图像生成。为了与丹麦和格陵兰地质调查局(GEUS)和格陵兰冰川测绘项目提供的格陵兰边缘数据保持一致,年度总量被缩减为 150 米网格。对格陵兰岛七个主要冰川盆地的 MSI 范围的年际变化进行了推导和分析,这七个盆地分为主冰原(以静态地图表示)和外围区域(所有变化均源自这些区域)。在七个区域中,有四个区域的 MSI 范围在统计上呈现显著的负趋势。整个格陵兰地区的冰雪范围也呈下降趋势,但在统计上并不显著。全区域和外围地区的冰雪范围从 2012 年观测到的最小值 1.807 × 10⁶ 平方公里(外围地区为 1.449 × 10⁵ 平方公里)到 2006 年观测到的最大值 1.860 × 10⁶ 平方公里(1.977 × 10⁵ 平方公里)不等,平均值为 1.829 × 10⁶ 平方公里(1.664 × 10⁵ 平方公里)。得出的 MSI 变化与 ERA5 陆地再分析的近地表 2 米气温和 GEUS 的格陵兰冰质量平衡在统计上有显著相关性,整个区域的相关系数分别为-0.74 和 0.53。冰川学数据库中包含的许多外围冰川和冰架的分布图以及 IPCC 报告中使用的分布图与我们的结果并不总是一致,需要改进,尤其是在沿海地区。
本文章由计算机程序翻译,如有差异,请以英文原文为准。
Annual Minimum Snow/Ice Extent Variations over Greenland since 2000: Ice Sheet, Peripheral Areas, and Relation to Ice Mass Balance
Abstract A novel satellite image processing technique was utilized to produce an annual time series of the Minimum Snow/Ice (MSI) extent over the entire Greenland landmass for the period 2000-2022. The information was derived from the Moderate Resolution Imaging Spectroradiometer 10-day clear-sky composites over the April-September period. The data products were generated from 250-m swath imagery. The annual aggregates were downscaled to a 150-m grid for consistency with data on margins of Greenland available from the Geological Survey of Denmark and Greenland (GEUS), and the Greenland Ice Mapping Project. Inter-annual variations in the MSI extent were derived and analyzed for each of the seven major glacier basins in Greenland split into the main ice sheet, represented by a static map, and the peripheral areas from which all variations originated. Four of the seven regions demonstrated statistically significant negative trends in the MSI extent. The entire Greenland area also showed a declining snow/ice extent although this was not statistically significant. The region-wide and peripheral snow/ice extent varied from a minimum of 1.807 × 106 km2 (1.449 × 105 km2 for peripheral areas) observed in 2012 to a maximum of 1.860 × 106 km2 (1.977 × 105 km2) observed in 2006 with an average value of 1.829 × 106 km2 (1.664 × 105 km2). The derived MSI variations showed statistically significant correlation with the near-surface 2- m air temperature from the ERA5 Land reanalysis and Greenland ice mass balance from GEUS for all catchments, with correlation coefficients for the entire area equal to −0.74 and 0.53, respectively. The mapping of many peripheral glaciers and ice shelves included in the glaciology databases and utilized for the IPCC reporting is not always consistent with our results and requires improvement, especially in the coastal areas.
求助全文
通过发布文献求助,成功后即可免费获取论文全文。 去求助
来源期刊
CiteScore
9.80
自引率
6.20%
发文量
231
审稿时长
6-12 weeks
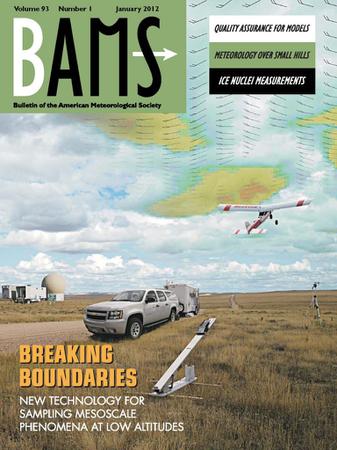
期刊介绍: The Bulletin of the American Meteorological Society (BAMS) is the flagship magazine of AMS and publishes articles of interest and significance for the weather, water, and climate community as well as news, editorials, and reviews for AMS members.
×
引用
GB/T 7714-2015
复制
MLA
复制
APA
复制
导出至
BibTeX EndNote RefMan NoteFirst NoteExpress
×
提示
您的信息不完整,为了账户安全,请先补充。
现在去补充
×
提示
您因"违规操作"
具体请查看互助需知
我知道了
×
提示
确定
请完成安全验证×
copy
已复制链接
快去分享给好友吧!
我知道了
右上角分享
点击右上角分享
0
联系我们:info@booksci.cn Book学术提供免费学术资源搜索服务,方便国内外学者检索中英文文献。致力于提供最便捷和优质的服务体验。 Copyright © 2023 布克学术 All rights reserved.
京ICP备2023020795号-1
ghs 京公网安备 11010802042870号
Book学术文献互助
Book学术文献互助群
群 号:481959085
Book学术官方微信