Bradley A. Ruple, Christopher G. Vann, Casey L. Sexton, Shelby C. Osburn, Morgan A. Smith, Joshua S. Godwin, Petey W. Mumford, Matt S. Stock, Michael D. Roberts, Kaelin C. Young
{"title":"外周定量计算机断层扫描是跟踪骨骼肌横截面积变化的有效成像技术。","authors":"Bradley A. Ruple, Christopher G. Vann, Casey L. Sexton, Shelby C. Osburn, Morgan A. Smith, Joshua S. Godwin, Petey W. Mumford, Matt S. Stock, Michael D. Roberts, Kaelin C. Young","doi":"10.1111/cpf.12885","DOIUrl":null,"url":null,"abstract":"<p>Peripheral quantitative computed tomography (pQCT) has recently expanded to quantifying skeletal muscle, however its validity to determine muscle cross-sectional area (mCSA) compared to magnetic resonance imaging (MRI) is unknown. Eleven male participants (age: 22 ± 3 y) underwent pQCT and MRI dual-leg mid-thigh imaging before (PRE) and after (POST) 6 weeks of resistance training for quantification of mid-thigh mCSA and change in mCSA. mCSA agreement at both time points and absolute change in mCSA across time was assessed using Bland-Altman plots for mean bias and 95% limits of agreement (LOA), as well as Lin's concordance correlation coefficients (CCC). Both pQCT and MRI mCSA increased following 6 weeks of resistance training (∆mCSA<sub>pQCT</sub>: 6.7 ± 5.4 cm<sup>2</sup>, <i>p</i> < 0.001; ∆mCSA<sub>MRI</sub>: 6.0 ± 6.4 cm<sup>2</sup>, <i>p</i> < 0.001). Importantly, the change in mCSA was not different between methods (<i>p</i> = 0.39). Bland-Altman analysis revealed a small mean bias (1.10 cm<sup>2</sup>, LOA: −6.09, 8.29 cm<sup>2</sup>) where pQCT tended to overestimate mCSA relative to MRI when comparing images at a single time point. Concordance between pQCT and MRI mCSA at PRE and POST was excellent yielding a CCC of 0.982. For detecting changes in mCSA, Bland-Altman analysis revealed excellent agreement between pQCT and MRI (mean bias: −0.73 cm<sup>2</sup>, LOA: −8.37, 6.91 cm<sup>2</sup>). Finally, there was excellent concordance between pQCT and MRI mCSA change scores (CCC = 0.779). Relative to MRI, pQCT imaging is a valid technique for measuring both mid-thigh mCSA at a single time point and mCSA changes following a resistance training intervention.</p>","PeriodicalId":10504,"journal":{"name":"Clinical Physiology and Functional Imaging","volume":"44 5","pages":"407-414"},"PeriodicalIF":1.3000,"publicationDate":"2024-04-26","publicationTypes":"Journal Article","fieldsOfStudy":null,"isOpenAccess":false,"openAccessPdf":"https://onlinelibrary.wiley.com/doi/epdf/10.1111/cpf.12885","citationCount":"0","resultStr":"{\"title\":\"Peripheral quantitative computed tomography is a valid imaging technique for tracking changes in skeletal muscle cross-sectional area\",\"authors\":\"Bradley A. Ruple, Christopher G. Vann, Casey L. Sexton, Shelby C. Osburn, Morgan A. Smith, Joshua S. Godwin, Petey W. Mumford, Matt S. Stock, Michael D. Roberts, Kaelin C. Young\",\"doi\":\"10.1111/cpf.12885\",\"DOIUrl\":null,\"url\":null,\"abstract\":\"<p>Peripheral quantitative computed tomography (pQCT) has recently expanded to quantifying skeletal muscle, however its validity to determine muscle cross-sectional area (mCSA) compared to magnetic resonance imaging (MRI) is unknown. Eleven male participants (age: 22 ± 3 y) underwent pQCT and MRI dual-leg mid-thigh imaging before (PRE) and after (POST) 6 weeks of resistance training for quantification of mid-thigh mCSA and change in mCSA. mCSA agreement at both time points and absolute change in mCSA across time was assessed using Bland-Altman plots for mean bias and 95% limits of agreement (LOA), as well as Lin's concordance correlation coefficients (CCC). Both pQCT and MRI mCSA increased following 6 weeks of resistance training (∆mCSA<sub>pQCT</sub>: 6.7 ± 5.4 cm<sup>2</sup>, <i>p</i> < 0.001; ∆mCSA<sub>MRI</sub>: 6.0 ± 6.4 cm<sup>2</sup>, <i>p</i> < 0.001). Importantly, the change in mCSA was not different between methods (<i>p</i> = 0.39). Bland-Altman analysis revealed a small mean bias (1.10 cm<sup>2</sup>, LOA: −6.09, 8.29 cm<sup>2</sup>) where pQCT tended to overestimate mCSA relative to MRI when comparing images at a single time point. Concordance between pQCT and MRI mCSA at PRE and POST was excellent yielding a CCC of 0.982. For detecting changes in mCSA, Bland-Altman analysis revealed excellent agreement between pQCT and MRI (mean bias: −0.73 cm<sup>2</sup>, LOA: −8.37, 6.91 cm<sup>2</sup>). Finally, there was excellent concordance between pQCT and MRI mCSA change scores (CCC = 0.779). Relative to MRI, pQCT imaging is a valid technique for measuring both mid-thigh mCSA at a single time point and mCSA changes following a resistance training intervention.</p>\",\"PeriodicalId\":10504,\"journal\":{\"name\":\"Clinical Physiology and Functional Imaging\",\"volume\":\"44 5\",\"pages\":\"407-414\"},\"PeriodicalIF\":1.3000,\"publicationDate\":\"2024-04-26\",\"publicationTypes\":\"Journal Article\",\"fieldsOfStudy\":null,\"isOpenAccess\":false,\"openAccessPdf\":\"https://onlinelibrary.wiley.com/doi/epdf/10.1111/cpf.12885\",\"citationCount\":\"0\",\"resultStr\":null,\"platform\":\"Semanticscholar\",\"paperid\":null,\"PeriodicalName\":\"Clinical Physiology and Functional Imaging\",\"FirstCategoryId\":\"3\",\"ListUrlMain\":\"https://onlinelibrary.wiley.com/doi/10.1111/cpf.12885\",\"RegionNum\":4,\"RegionCategory\":\"医学\",\"ArticlePicture\":[],\"TitleCN\":null,\"AbstractTextCN\":null,\"PMCID\":null,\"EPubDate\":\"\",\"PubModel\":\"\",\"JCR\":\"Q4\",\"JCRName\":\"PHYSIOLOGY\",\"Score\":null,\"Total\":0}","platform":"Semanticscholar","paperid":null,"PeriodicalName":"Clinical Physiology and Functional Imaging","FirstCategoryId":"3","ListUrlMain":"https://onlinelibrary.wiley.com/doi/10.1111/cpf.12885","RegionNum":4,"RegionCategory":"医学","ArticlePicture":[],"TitleCN":null,"AbstractTextCN":null,"PMCID":null,"EPubDate":"","PubModel":"","JCR":"Q4","JCRName":"PHYSIOLOGY","Score":null,"Total":0}
Peripheral quantitative computed tomography is a valid imaging technique for tracking changes in skeletal muscle cross-sectional area
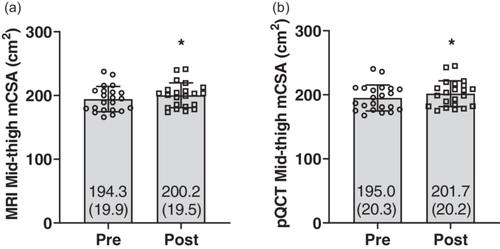
Peripheral quantitative computed tomography (pQCT) has recently expanded to quantifying skeletal muscle, however its validity to determine muscle cross-sectional area (mCSA) compared to magnetic resonance imaging (MRI) is unknown. Eleven male participants (age: 22 ± 3 y) underwent pQCT and MRI dual-leg mid-thigh imaging before (PRE) and after (POST) 6 weeks of resistance training for quantification of mid-thigh mCSA and change in mCSA. mCSA agreement at both time points and absolute change in mCSA across time was assessed using Bland-Altman plots for mean bias and 95% limits of agreement (LOA), as well as Lin's concordance correlation coefficients (CCC). Both pQCT and MRI mCSA increased following 6 weeks of resistance training (∆mCSApQCT: 6.7 ± 5.4 cm2, p < 0.001; ∆mCSAMRI: 6.0 ± 6.4 cm2, p < 0.001). Importantly, the change in mCSA was not different between methods (p = 0.39). Bland-Altman analysis revealed a small mean bias (1.10 cm2, LOA: −6.09, 8.29 cm2) where pQCT tended to overestimate mCSA relative to MRI when comparing images at a single time point. Concordance between pQCT and MRI mCSA at PRE and POST was excellent yielding a CCC of 0.982. For detecting changes in mCSA, Bland-Altman analysis revealed excellent agreement between pQCT and MRI (mean bias: −0.73 cm2, LOA: −8.37, 6.91 cm2). Finally, there was excellent concordance between pQCT and MRI mCSA change scores (CCC = 0.779). Relative to MRI, pQCT imaging is a valid technique for measuring both mid-thigh mCSA at a single time point and mCSA changes following a resistance training intervention.
期刊介绍:
Clinical Physiology and Functional Imaging publishes reports on clinical and experimental research pertinent to human physiology in health and disease. The scope of the Journal is very broad, covering all aspects of the regulatory system in the cardiovascular, renal and pulmonary systems with special emphasis on methodological aspects. The focus for the journal is, however, work that has potential clinical relevance. The Journal also features review articles on recent front-line research within these fields of interest.
Covered by the major abstracting services including Current Contents and Science Citation Index, Clinical Physiology and Functional Imaging plays an important role in providing effective and productive communication among clinical physiologists world-wide.
 求助内容:
求助内容: 应助结果提醒方式:


