Bo Yao, Xiaolong Wang, Yancheng Wang, Tianyang Ye, Enli Wang, Qiang Cao, Xia Yao, Yan Zhu, Weixing Cao, Xiaojun Liu, Liang Tang
{"title":"Interaction of Genotype, Environment, and Management on Organ-Specific Critical Nitrogen Dilution Curve in Wheat.","authors":"Bo Yao, Xiaolong Wang, Yancheng Wang, Tianyang Ye, Enli Wang, Qiang Cao, Xia Yao, Yan Zhu, Weixing Cao, Xiaojun Liu, Liang Tang","doi":"10.34133/plantphenomics.0078","DOIUrl":null,"url":null,"abstract":"<p><p>The organ-specific critical nitrogen (N<sub>c</sub>) dilution curves are widely thought to represent a new approach for crop nitrogen (N) nutrition diagnosis, N management, and crop modeling. The N<sub>c</sub> dilution curve can be described by a power function (N<sub>c</sub> = A<sub>1</sub>·W<sup>-A2</sup>), while parameters A<sub>1</sub> and A<sub>2</sub> control the starting point and slope. This study aimed to investigate the uncertainty and drivers of organ-specific curves under different conditions. By using hierarchical Bayesian theory, parameters A<sub>1</sub> and A<sub>2</sub> of the organ-specific N<sub>c</sub> dilution curves for wheat were derived and evaluated under 14 different genotype × environment × management (G × E × M) N fertilizer experiments. Our results show that parameters A<sub>1</sub> and A<sub>2</sub> are highly correlated. Although the variation of parameter A<sub>1</sub> was less than that of A<sub>2</sub>, the values of both parameters can change significantly in response to G × E × M. Nitrogen nutrition index (NNI) calculated using organ-specific N<sub>c</sub> is in general consistent with NNI estimated with overall shoot N<sub>c</sub>, indicating that a simple organ-specific N<sub>c</sub> dilution curve may be used for wheat N diagnosis to assist N management. However, the significant differences in organ-specific N<sub>c</sub> dilution curves across G × E × M conditions imply potential errors in N<sub>c</sub> and crop N demand estimated using a general N<sub>c</sub> dilution curve in crop models, highlighting a clear need for improvement in N<sub>c</sub> calculations in such models. Our results provide new insights into how to improve modeling of crop nitrogen-biomass relations and N management practices under G × E × M.</p>","PeriodicalId":20318,"journal":{"name":"Plant Phenomics","volume":"5 ","pages":"0078"},"PeriodicalIF":6.4000,"publicationDate":"2023-01-01","publicationTypes":"Journal Article","fieldsOfStudy":null,"isOpenAccess":false,"openAccessPdf":"https://www.ncbi.nlm.nih.gov/pmc/articles/PMC10396079/pdf/","citationCount":"0","resultStr":null,"platform":"Semanticscholar","paperid":null,"PeriodicalName":"Plant Phenomics","FirstCategoryId":"97","ListUrlMain":"https://doi.org/10.34133/plantphenomics.0078","RegionNum":1,"RegionCategory":"农林科学","ArticlePicture":[],"TitleCN":null,"AbstractTextCN":null,"PMCID":null,"EPubDate":"","PubModel":"","JCR":"Q1","JCRName":"AGRONOMY","Score":null,"Total":0}
引用次数: 0
Abstract
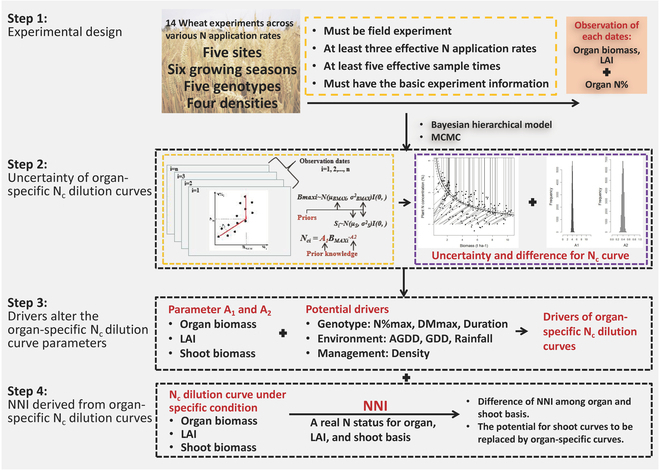
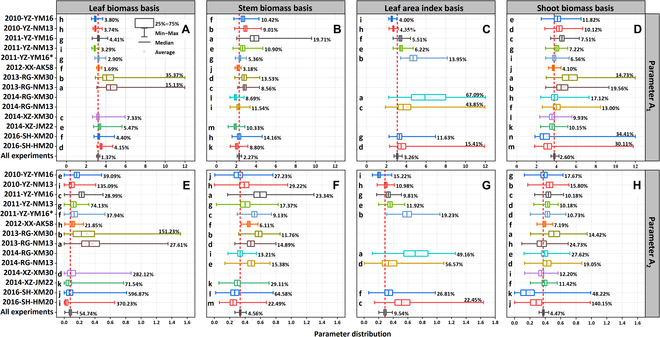
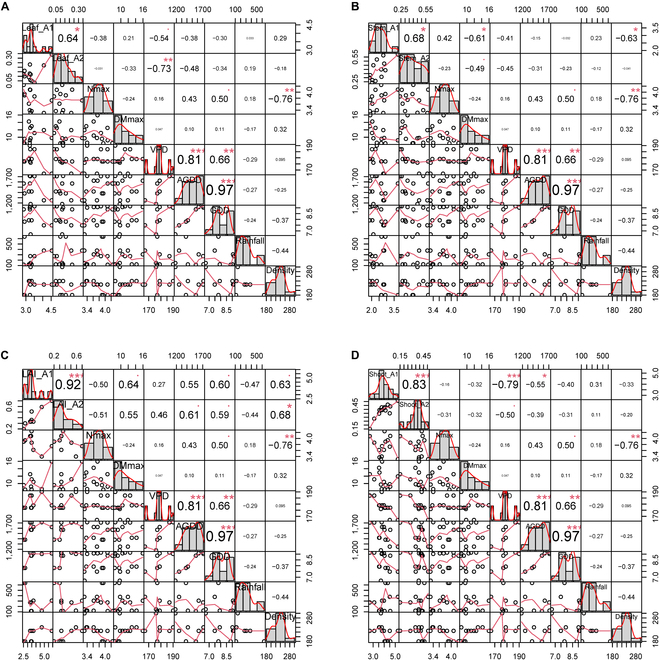
The organ-specific critical nitrogen (Nc) dilution curves are widely thought to represent a new approach for crop nitrogen (N) nutrition diagnosis, N management, and crop modeling. The Nc dilution curve can be described by a power function (Nc = A1·W-A2), while parameters A1 and A2 control the starting point and slope. This study aimed to investigate the uncertainty and drivers of organ-specific curves under different conditions. By using hierarchical Bayesian theory, parameters A1 and A2 of the organ-specific Nc dilution curves for wheat were derived and evaluated under 14 different genotype × environment × management (G × E × M) N fertilizer experiments. Our results show that parameters A1 and A2 are highly correlated. Although the variation of parameter A1 was less than that of A2, the values of both parameters can change significantly in response to G × E × M. Nitrogen nutrition index (NNI) calculated using organ-specific Nc is in general consistent with NNI estimated with overall shoot Nc, indicating that a simple organ-specific Nc dilution curve may be used for wheat N diagnosis to assist N management. However, the significant differences in organ-specific Nc dilution curves across G × E × M conditions imply potential errors in Nc and crop N demand estimated using a general Nc dilution curve in crop models, highlighting a clear need for improvement in Nc calculations in such models. Our results provide new insights into how to improve modeling of crop nitrogen-biomass relations and N management practices under G × E × M.
器官特异性临界氮(Nc)稀释曲线被广泛认为代表了作物氮(N)营养诊断、氮管理和作物建模的新方法。Nc稀释曲线可以用幂函数来描述(Nc = A1·W-A2),参数A1和A2控制起始点和斜率。本研究旨在探讨不同条件下器官特异性曲线的不确定性及其驱动因素。利用层次贝叶斯理论,推导了14种不同基因型×环境×管理(G × E × M)氮肥试验下小麦器官特异性Nc稀释曲线的参数A1和A2,并对其进行了评价。我们的结果表明,参数A1和A2是高度相关的。尽管参数A1的变化小于A2,但两个参数的值均随G × E × m的变化而发生显著变化。利用器官特异性Nc计算的氮素营养指数(NNI)与利用全茎部Nc估算的NNI基本一致,表明简单的器官特异性Nc稀释曲线可用于小麦氮素诊断,辅助氮素管理。然而,在G × E × M条件下,器官特异性Nc稀释曲线的显著差异意味着在作物模型中使用一般Nc稀释曲线估计的Nc和作物N需求可能存在误差,这突出了该模型中Nc计算的明显需要改进。本研究结果为改进gxexm条件下作物氮素-生物量关系模型和氮素管理实践提供了新的见解。
期刊介绍:
Plant Phenomics is an Open Access journal published in affiliation with the State Key Laboratory of Crop Genetics & Germplasm Enhancement, Nanjing Agricultural University (NAU) and published by the American Association for the Advancement of Science (AAAS). Like all partners participating in the Science Partner Journal program, Plant Phenomics is editorially independent from the Science family of journals.
The mission of Plant Phenomics is to publish novel research that will advance all aspects of plant phenotyping from the cell to the plant population levels using innovative combinations of sensor systems and data analytics. Plant Phenomics aims also to connect phenomics to other science domains, such as genomics, genetics, physiology, molecular biology, bioinformatics, statistics, mathematics, and computer sciences. Plant Phenomics should thus contribute to advance plant sciences and agriculture/forestry/horticulture by addressing key scientific challenges in the area of plant phenomics.
The scope of the journal covers the latest technologies in plant phenotyping for data acquisition, data management, data interpretation, modeling, and their practical applications for crop cultivation, plant breeding, forestry, horticulture, ecology, and other plant-related domains.
 求助内容:
求助内容: 应助结果提醒方式:


