Nana Wu, Guannan Geng, Xinying Qin, Dan Tong, Yixuan Zheng, Yu Lei and Qiang Zhang*,
{"title":"Daily Emission Patterns of Coal-Fired Power Plants in China Based on Multisource Data Fusion","authors":"Nana Wu, Guannan Geng, Xinying Qin, Dan Tong, Yixuan Zheng, Yu Lei and Qiang Zhang*, ","doi":"10.1021/acsenvironau.2c00014","DOIUrl":null,"url":null,"abstract":"<p >Daily emission estimates are essential for tracking the dynamic changes in emission sources. In this work, we estimate daily emissions of coal-fired power plants in China during 2017–2020 by combining information from the unit-based China coal-fired Power plant Emissions Database (CPED) and real-time measurements from continuous emission monitoring systems (CEMS). We develop a step-by-step method to screen outliers and impute missing values for data from CEMS. Then, plant-level daily profiles of flue gas volume and emissions obtained from CEMS are coupled with annual emissions from CPED to derive daily emissions. Reasonable agreement is found between emission variations and available statistics (i.e., monthly power generation and daily coal consumption). Daily power emissions are in the range of 6267–12,994, 0.4–1.3, 6.5–12.0, and 2.5–6.8 Gg for CO<sub>2</sub>, PM<sub>2.5</sub>, NO<i><sub>x</sub></i>, and SO<sub>2</sub>, respectively, with high emissions in winter and summer caused by heating and cooling demand. Our estimates can capture sudden decreases (e.g., those associated with COVID-19 lockdowns and short-term emission controls) or increases (e.g., those related to a drought) in daily power emissions during typical socioeconomic events. We also find that weekly patterns from CEMS exhibit no obvious weekend effect compared to those in previous studies. The daily power emissions will help to improve chemical transport modeling and facilitate policy formulation.</p>","PeriodicalId":29801,"journal":{"name":"ACS Environmental Au","volume":"2 4","pages":"363–372"},"PeriodicalIF":7.7000,"publicationDate":"2022-05-17","publicationTypes":"Journal Article","fieldsOfStudy":null,"isOpenAccess":false,"openAccessPdf":"https://ftp.ncbi.nlm.nih.gov/pub/pmc/oa_pdf/9a/a5/vg2c00014.PMC10125283.pdf","citationCount":"3","resultStr":null,"platform":"Semanticscholar","paperid":null,"PeriodicalName":"ACS Environmental Au","FirstCategoryId":"1085","ListUrlMain":"https://pubs.acs.org/doi/10.1021/acsenvironau.2c00014","RegionNum":0,"RegionCategory":null,"ArticlePicture":[],"TitleCN":null,"AbstractTextCN":null,"PMCID":null,"EPubDate":"","PubModel":"","JCR":"Q1","JCRName":"ENGINEERING, ENVIRONMENTAL","Score":null,"Total":0}
引用次数: 3
Abstract
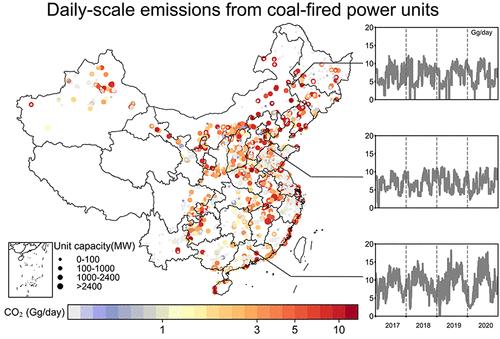
Daily emission estimates are essential for tracking the dynamic changes in emission sources. In this work, we estimate daily emissions of coal-fired power plants in China during 2017–2020 by combining information from the unit-based China coal-fired Power plant Emissions Database (CPED) and real-time measurements from continuous emission monitoring systems (CEMS). We develop a step-by-step method to screen outliers and impute missing values for data from CEMS. Then, plant-level daily profiles of flue gas volume and emissions obtained from CEMS are coupled with annual emissions from CPED to derive daily emissions. Reasonable agreement is found between emission variations and available statistics (i.e., monthly power generation and daily coal consumption). Daily power emissions are in the range of 6267–12,994, 0.4–1.3, 6.5–12.0, and 2.5–6.8 Gg for CO2, PM2.5, NOx, and SO2, respectively, with high emissions in winter and summer caused by heating and cooling demand. Our estimates can capture sudden decreases (e.g., those associated with COVID-19 lockdowns and short-term emission controls) or increases (e.g., those related to a drought) in daily power emissions during typical socioeconomic events. We also find that weekly patterns from CEMS exhibit no obvious weekend effect compared to those in previous studies. The daily power emissions will help to improve chemical transport modeling and facilitate policy formulation.
期刊介绍:
ACS Environmental Au is an open access journal which publishes experimental research and theoretical results in all aspects of environmental science and technology both pure and applied. Short letters comprehensive articles reviews and perspectives are welcome in the following areas:Alternative EnergyAnthropogenic Impacts on Atmosphere Soil or WaterBiogeochemical CyclingBiomass or Wastes as ResourcesContaminants in Aquatic and Terrestrial EnvironmentsEnvironmental Data ScienceEcotoxicology and Public HealthEnergy and ClimateEnvironmental Modeling Processes and Measurement Methods and TechnologiesEnvironmental Nanotechnology and BiotechnologyGreen ChemistryGreen Manufacturing and EngineeringRisk assessment Regulatory Frameworks and Life-Cycle AssessmentsTreatment and Resource Recovery and Waste Management
 求助内容:
求助内容: 应助结果提醒方式:


