Hasan Nawaz, Salman Tariq, Zia ul Haq, Usman Mehmood
{"title":"Identifying the natural and anthropogenic drivers of absorbing aerosols using OMI data and HYSPLIT model over South Asia","authors":"Hasan Nawaz, Salman Tariq, Zia ul Haq, Usman Mehmood","doi":"10.1007/s11869-023-01423-z","DOIUrl":null,"url":null,"abstract":"<div><p>Aerosols absorption contributes significantly to the total radiative effects of aerosols and so an important component of radiative forcing estimates. Therefore, this study explores the spatiotemporal distribution of ultraviolet aerosol index (UVAI), future trends, potential sources of absorbing aerosols and their relationship with temperature, wind speed, precipitation and total ozone column using Ozone Monitoring Instrument retrieved UVAI and HYSPLIT model over South Asia during October 2004 to March 2022. The mean UVAI within the ranges of 0.56–1.62 are observed over Eastern and Southern Pakistan and Northern India associated with dust and biomass burning aerosols. The interannual variations in UVAI show that the values of UVAI increases from 1.73 to 3.11 during 2018–2021 over the Indo-Gangetic Plain. Contrary to this, UVAI < 0 is observed along the Karakorum and Himalaya range during 2005–2021 indicating presence of non-absorbing aerosols. The interaannual variations in <u>U</u>VAI reveal highest UVAI of 0.64 in December followed by 0.51 in July over South Asia. Seasonally, UVAI shows increasing trend at the rate of 0.9064 DJF<sup>−1</sup>, 0.3810 JJA<sup>−1</sup>, 0.2707 SON<sup>−1</sup> and 0.0774 MAM<sup>−1</sup> over South Asia. A positive correlation of 0.56 is observed between UVAI and wind speed followed by over Southern Pakistan followed 0.43 between UVAI and total ozone column Southern Pakistan and India. The UVAI shows increasing trend at the rate of 0.1409, 0.1124, 0.1224, 0.1015, 0.1242 and 0.2054 per year over Lahore, Karachi, Kanpur, New-Delhi, Varanasi, and Dhaka with maximum UVAI of 5.55, 4.47, 4.51, 4.99, 4.61 and 4.65 respectively during the study period. The anthropogenic productivity analysis reveals that primary industry and secondary industry contributes in lowering UVAI values whereas tertiary industry, energy consumption and gross domestic products increase aerosols loading in South Asia. Moreover, HYSPLIT cluster analysis further reveals the localized and trans-boundary sources of absorbing aerosols over the selected cities.</p></div>","PeriodicalId":49109,"journal":{"name":"Air Quality Atmosphere and Health","volume":null,"pages":null},"PeriodicalIF":2.9000,"publicationDate":"2023-09-05","publicationTypes":"Journal Article","fieldsOfStudy":null,"isOpenAccess":false,"openAccessPdf":"https://link.springer.com/content/pdf/10.1007/s11869-023-01423-z.pdf","citationCount":"1","resultStr":null,"platform":"Semanticscholar","paperid":null,"PeriodicalName":"Air Quality Atmosphere and Health","FirstCategoryId":"93","ListUrlMain":"https://link.springer.com/article/10.1007/s11869-023-01423-z","RegionNum":4,"RegionCategory":"环境科学与生态学","ArticlePicture":[],"TitleCN":null,"AbstractTextCN":null,"PMCID":null,"EPubDate":"","PubModel":"","JCR":"Q3","JCRName":"ENVIRONMENTAL SCIENCES","Score":null,"Total":0}
引用次数: 1
Abstract
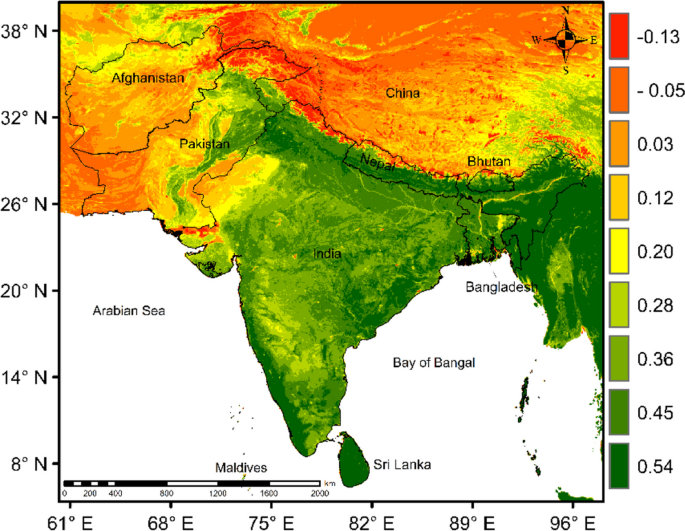
Aerosols absorption contributes significantly to the total radiative effects of aerosols and so an important component of radiative forcing estimates. Therefore, this study explores the spatiotemporal distribution of ultraviolet aerosol index (UVAI), future trends, potential sources of absorbing aerosols and their relationship with temperature, wind speed, precipitation and total ozone column using Ozone Monitoring Instrument retrieved UVAI and HYSPLIT model over South Asia during October 2004 to March 2022. The mean UVAI within the ranges of 0.56–1.62 are observed over Eastern and Southern Pakistan and Northern India associated with dust and biomass burning aerosols. The interannual variations in UVAI show that the values of UVAI increases from 1.73 to 3.11 during 2018–2021 over the Indo-Gangetic Plain. Contrary to this, UVAI < 0 is observed along the Karakorum and Himalaya range during 2005–2021 indicating presence of non-absorbing aerosols. The interaannual variations in UVAI reveal highest UVAI of 0.64 in December followed by 0.51 in July over South Asia. Seasonally, UVAI shows increasing trend at the rate of 0.9064 DJF−1, 0.3810 JJA−1, 0.2707 SON−1 and 0.0774 MAM−1 over South Asia. A positive correlation of 0.56 is observed between UVAI and wind speed followed by over Southern Pakistan followed 0.43 between UVAI and total ozone column Southern Pakistan and India. The UVAI shows increasing trend at the rate of 0.1409, 0.1124, 0.1224, 0.1015, 0.1242 and 0.2054 per year over Lahore, Karachi, Kanpur, New-Delhi, Varanasi, and Dhaka with maximum UVAI of 5.55, 4.47, 4.51, 4.99, 4.61 and 4.65 respectively during the study period. The anthropogenic productivity analysis reveals that primary industry and secondary industry contributes in lowering UVAI values whereas tertiary industry, energy consumption and gross domestic products increase aerosols loading in South Asia. Moreover, HYSPLIT cluster analysis further reveals the localized and trans-boundary sources of absorbing aerosols over the selected cities.
期刊介绍:
Air Quality, Atmosphere, and Health is a multidisciplinary journal which, by its very name, illustrates the broad range of work it publishes and which focuses on atmospheric consequences of human activities and their implications for human and ecological health.
It offers research papers, critical literature reviews and commentaries, as well as special issues devoted to topical subjects or themes.
International in scope, the journal presents papers that inform and stimulate a global readership, as the topic addressed are global in their import. Consequently, we do not encourage submission of papers involving local data that relate to local problems. Unless they demonstrate wide applicability, these are better submitted to national or regional journals.
Air Quality, Atmosphere & Health addresses such topics as acid precipitation; airborne particulate matter; air quality monitoring and management; exposure assessment; risk assessment; indoor air quality; atmospheric chemistry; atmospheric modeling and prediction; air pollution climatology; climate change and air quality; air pollution measurement; atmospheric impact assessment; forest-fire emissions; atmospheric science; greenhouse gases; health and ecological effects; clean air technology; regional and global change and satellite measurements.
This journal benefits a diverse audience of researchers, public health officials and policy makers addressing problems that call for solutions based in evidence from atmospheric and exposure assessment scientists, epidemiologists, and risk assessors. Publication in the journal affords the opportunity to reach beyond defined disciplinary niches to this broader readership.
 求助内容:
求助内容: 应助结果提醒方式:


