A. N. Shevtsov, A. E. Hannibal, T. G. Korotkova, A. A. Skorokhodov
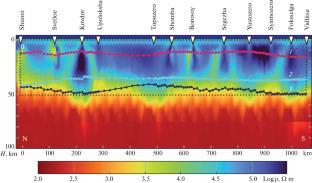
{"title":"Results of 2D Inversion of Data from Deep Electromagnetic Probing with Industrial Power Lines (FENICS Experiment)","authors":"A. N. Shevtsov, A. E. Hannibal, T. G. Korotkova, A. A. Skorokhodov","doi":"10.3103/S0747923922080114","DOIUrl":null,"url":null,"abstract":"<p>At the stages of the FENICS experiment conducted in 2014 and 2019, unique data on deep electromagnetic sounding with grounded sections of industrial power lines were obtained at distances from 180 to 940 km from the center of the supply line to the measuring installation. The electromagnetic field components were recorded by VMTU-10 measuring equipment (VEGA, St. Petersburg). The fluctuations of the current in the supply line were recorded as a time series with a sampling rate of 1 kHz. Based on synchronous time series of the field components at the observation points and the current strength in the supply vibrator, estimates of the power spectra of the autocorrelation and cross-correlation functions of the recorded values were calculated using fast Fourier transform (FFT). The resulting spectral characteristics were used to determine the amplitudes of the field components of the source and phase shifts between them, as well as to estimate the impedance tensor components. To do this, correction factors were calculated for the ratio of the apparent resistivity values for the horizontal magnetic field component to those for the impedance and electric field. A 2D interpretation is made and estimates of the resistivity allocation at depth are obtained for two sublongitudinal and sublatitudinal profiles of the Karelia–Kola region.</p>","PeriodicalId":45174,"journal":{"name":"Seismic Instruments","volume":"58 2","pages":"S302 - S310"},"PeriodicalIF":0.3000,"publicationDate":"2023-03-21","publicationTypes":"Journal Article","fieldsOfStudy":null,"isOpenAccess":false,"openAccessPdf":"","citationCount":"0","resultStr":null,"platform":"Semanticscholar","paperid":null,"PeriodicalName":"Seismic Instruments","FirstCategoryId":"1085","ListUrlMain":"https://link.springer.com/article/10.3103/S0747923922080114","RegionNum":0,"RegionCategory":null,"ArticlePicture":[],"TitleCN":null,"AbstractTextCN":null,"PMCID":null,"EPubDate":"","PubModel":"","JCR":"Q4","JCRName":"GEOCHEMISTRY & GEOPHYSICS","Score":null,"Total":0}
引用次数: 0
Abstract
At the stages of the FENICS experiment conducted in 2014 and 2019, unique data on deep electromagnetic sounding with grounded sections of industrial power lines were obtained at distances from 180 to 940 km from the center of the supply line to the measuring installation. The electromagnetic field components were recorded by VMTU-10 measuring equipment (VEGA, St. Petersburg). The fluctuations of the current in the supply line were recorded as a time series with a sampling rate of 1 kHz. Based on synchronous time series of the field components at the observation points and the current strength in the supply vibrator, estimates of the power spectra of the autocorrelation and cross-correlation functions of the recorded values were calculated using fast Fourier transform (FFT). The resulting spectral characteristics were used to determine the amplitudes of the field components of the source and phase shifts between them, as well as to estimate the impedance tensor components. To do this, correction factors were calculated for the ratio of the apparent resistivity values for the horizontal magnetic field component to those for the impedance and electric field. A 2D interpretation is made and estimates of the resistivity allocation at depth are obtained for two sublongitudinal and sublatitudinal profiles of the Karelia–Kola region.
期刊介绍:
Seismic Instruments is a journal devoted to the description of geophysical instruments used in seismic research. In addition to covering the actual instruments for registering seismic waves, substantial room is devoted to solving instrumental-methodological problems of geophysical monitoring, applying various methods that are used to search for earthquake precursors, to studying earthquake nucleation processes and to monitoring natural and technogenous processes. The description of the construction, working elements, and technical characteristics of the instruments, as well as some results of implementation of the instruments and interpretation of the results are given. Attention is paid to seismic monitoring data and earthquake catalog quality Analysis.
 求助内容:
求助内容: 应助结果提醒方式:


