Betelhem Fetene Admas , Temesgen Gashaw , Anwar A. Adem , Abeyou W. Worqlul , Yihun T. Dile , Eyayu Molla
{"title":"Identification of soil erosion hot-spot areas for prioritization of conservation measures using the SWAT model in Ribb watershed, Ethiopia","authors":"Betelhem Fetene Admas , Temesgen Gashaw , Anwar A. Adem , Abeyou W. Worqlul , Yihun T. Dile , Eyayu Molla","doi":"10.1016/j.resenv.2022.100059","DOIUrl":null,"url":null,"abstract":"<div><p>Soil erosion is one of the pressing environmental problem in Ethiopia Thus, identifying soil erosion hot-spot areas of a watershed/basin and isolating best management practices (BMPs) for soil erosion-prone sub-watersheds is imperative for effective soil loss reduction and lessening its on-site and off-site effects. The present study aimed to identify erosion hot-spot areas for prioritization of conservation measures and evaluate BMPs for reducing soil erosion using the Soil and Water Assessment Tool (SWAT) model in Ribb watershed, Ethiopia. The SWAT model was calibrated (1995–2002) and validated (2003–2008) using flow and sediment data in the SWAT Calibration and Uncertainty Program (SWAT-CUP). The NSE (Nash–Sutcliffe efficiency), R<sup>2</sup> (Coefficient of determination), PBIAS (Percent bias) and RSR (Root Mean Square Error — observations standard deviation ratio) values during flow and sediment calibration and validation periods ranged from 0.7 to 0.9, 0.71 to 0.92, -0.4% to 15.2% and 0.32 to 0.55, respectively, indicating that SWAT is able to simulate streamflow and sediment with sufficient accuracy. The calibrated and validated SWAT model was used to evaluate the effectiveness of three BMPs against the baseline conditions for reducing soil erosion, such as filter strips Scenario (Scenario F), stone/soil bunds Scenario (Scenario S) and reforestation Scenario (Scenario R). The result indicated that about 95% of the watershed are indentified as soil erosion hot-spot areas, which experienced sediment yield > 11 t ha <span><math><msup><mrow></mrow><mrow><mo>−</mo><mn>1</mn></mrow></msup></math></span> yr<span><math><msup><mrow></mrow><mrow><mo>−</mo><mn>1</mn></mrow></msup></math></span>. The mean annual sediment yield (1995–2008) of the watershed at the baseline conditions was nearly 29 t ha <span><math><msup><mrow></mrow><mrow><mo>−</mo><mn>1</mn></mrow></msup></math></span> yr<span><math><msup><mrow></mrow><mrow><mo>−</mo><mn>1</mn></mrow></msup></math></span>. The implementation of Scenario F, Scenario S and Scenario R reduced the baseline sediment yield by 28%, 76% and 62% at the watershed scale, respectively. At the sub-watershed levels, Scenario S and Scenario R reduced the mean annual sediment yield from 45%–90% and 0%–90%, respectively. Therefore, the study suggests implementations of Scenario S and Scenario R for effective soil erosion reduction in the study watershed in particular and to other watersheds in Ethiopia in general which have similar environmental settings.</p></div>","PeriodicalId":34479,"journal":{"name":"Resources Environment and Sustainability","volume":null,"pages":null},"PeriodicalIF":12.4000,"publicationDate":"2022-06-01","publicationTypes":"Journal Article","fieldsOfStudy":null,"isOpenAccess":false,"openAccessPdf":"https://www.sciencedirect.com/science/article/pii/S2666916122000147/pdfft?md5=e44d448cf488ff983b282f510be7afaa&pid=1-s2.0-S2666916122000147-main.pdf","citationCount":"10","resultStr":null,"platform":"Semanticscholar","paperid":null,"PeriodicalName":"Resources Environment and Sustainability","FirstCategoryId":"1085","ListUrlMain":"https://www.sciencedirect.com/science/article/pii/S2666916122000147","RegionNum":0,"RegionCategory":null,"ArticlePicture":[],"TitleCN":null,"AbstractTextCN":null,"PMCID":null,"EPubDate":"","PubModel":"","JCR":"Q1","JCRName":"ENVIRONMENTAL SCIENCES","Score":null,"Total":0}
引用次数: 10
Abstract
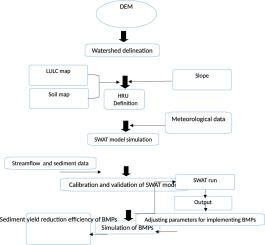
Soil erosion is one of the pressing environmental problem in Ethiopia Thus, identifying soil erosion hot-spot areas of a watershed/basin and isolating best management practices (BMPs) for soil erosion-prone sub-watersheds is imperative for effective soil loss reduction and lessening its on-site and off-site effects. The present study aimed to identify erosion hot-spot areas for prioritization of conservation measures and evaluate BMPs for reducing soil erosion using the Soil and Water Assessment Tool (SWAT) model in Ribb watershed, Ethiopia. The SWAT model was calibrated (1995–2002) and validated (2003–2008) using flow and sediment data in the SWAT Calibration and Uncertainty Program (SWAT-CUP). The NSE (Nash–Sutcliffe efficiency), R2 (Coefficient of determination), PBIAS (Percent bias) and RSR (Root Mean Square Error — observations standard deviation ratio) values during flow and sediment calibration and validation periods ranged from 0.7 to 0.9, 0.71 to 0.92, -0.4% to 15.2% and 0.32 to 0.55, respectively, indicating that SWAT is able to simulate streamflow and sediment with sufficient accuracy. The calibrated and validated SWAT model was used to evaluate the effectiveness of three BMPs against the baseline conditions for reducing soil erosion, such as filter strips Scenario (Scenario F), stone/soil bunds Scenario (Scenario S) and reforestation Scenario (Scenario R). The result indicated that about 95% of the watershed are indentified as soil erosion hot-spot areas, which experienced sediment yield > 11 t ha yr. The mean annual sediment yield (1995–2008) of the watershed at the baseline conditions was nearly 29 t ha yr. The implementation of Scenario F, Scenario S and Scenario R reduced the baseline sediment yield by 28%, 76% and 62% at the watershed scale, respectively. At the sub-watershed levels, Scenario S and Scenario R reduced the mean annual sediment yield from 45%–90% and 0%–90%, respectively. Therefore, the study suggests implementations of Scenario S and Scenario R for effective soil erosion reduction in the study watershed in particular and to other watersheds in Ethiopia in general which have similar environmental settings.
土壤侵蚀是埃塞俄比亚紧迫的环境问题之一,因此,确定流域/盆地的土壤侵蚀热点区域并隔离土壤侵蚀易发区的最佳管理实践(BMPs)对于有效减少土壤流失并减轻其现场和非现场影响至关重要。本研究旨在利用水土评估工具(SWAT)模型确定埃塞俄比亚Ribb流域的水土流失热点地区,并评估bmp对减少土壤侵蚀的作用。利用SWAT校准和不确定度计划(SWAT- cup)中的流量和泥沙数据,对SWAT模型进行了校准(1995-2002年)和验证(2003-2008年)。在水流和泥沙校准和验证期间,NSE(纳什-萨特克里夫效率)、R2(决定系数)、PBIAS(百分比偏差)和RSR(均方根误差-观测标准差比)值分别在0.7 ~ 0.9、0.71 ~ 0.92、-0.4% ~ 15.2%和0.32 ~ 0.55之间,表明SWAT能够较好地模拟水流和泥沙。利用经过校准和验证的SWAT模型,对3种bmp在减少土壤侵蚀的基线条件下的有效性进行了评估,即过滤带情景(情景F)、石/土带情景(情景S)和再造林情景(情景R)。结果表明,约95%的流域被确定为土壤侵蚀热点区域,这些区域经历了产沙和产沙;11 t ha - 1 yr - 1。在基线条件下,流域的年平均产沙量(1995-2008)接近29 t ha - 1 yr - 1。实施情景F、情景S和情景R分别使流域基准产沙量减少28%、76%和62%。在次流域水平上,情景S和情景R分别使年平均产沙量减少45% ~ 90%和0% ~ 90%。因此,该研究建议实施情景S和情景R,以有效减少研究流域的土壤侵蚀,并在埃塞俄比亚其他具有类似环境背景的流域实施。
 求助内容:
求助内容: 应助结果提醒方式:


