{"title":"The Test-Retest Variability of the COMPlog System in Participants with Induced Non-Normal Visual Acuity.","authors":"Mun Wei Kan, Anne Bjerre","doi":"10.22599/bioj.127","DOIUrl":null,"url":null,"abstract":"<p><strong>Aim: </strong>The aim of this study was to determine and compare test-retest variability (TRV) of the computerised visual acuity (VA) COMPlog system on participants with normal vision and non-normal vision induced by bangerter foils (BFs).</p><p><strong>Methods: </strong>Twenty adult volunteers with VA of 0.100 logMAR or better in each eye and no eye conditions were included. Monocular VA data using the COMPlog system under five conditions-with plain Plano glasses (visually normal condition) and four pairs of Plano glasses with BF strengths of 0.6, 0.3, 0.2 and 0.1 (induced non-normal vision conditions)-were collected on two separate visits. To reduce bias, the eye tested and order of the BFs assessed were randomised. Data comparison was analysed using 2-factor ANOVA and paired t-tests and Bland Altman analysis to assess TRV.</p><p><strong>Results: </strong>Mean VA score from the two visits was -0.072 ± 0.1 logMAR for Plano, 0.106 ± 0.1 logMAR for BF 0.6, 0.428 ± 0.1 logMAR for BF 0.3, 0.662 ± 0.09 logMAR for BF 0.2 and 0.850 ± 0.08 logMAR for BF 0.1. As BF density increased, VA score significantly worsened (p < 0.0001). Overall mean VA score from the first and second visit was 0.410 ± 0.4 logMAR and 0.379 ± 0.4 logMAR, respectively. This improvement was significant (p < 0.009). The 95% limits of agreement of the VA scores between testing conditions had a range of ±0.120 to ±0.220 logMAR.</p><p><strong>Conclusions: </strong>Increase in BF strength led to a worsened VA score. However, the COMPlog TRV under the visually normal and induced non-normal vision conditions were within a similar range (±0.120 to ±0.220 logMAR). VA significantly improved on the second visit, suggesting a possible learning effect, which could have a clinical impact.</p>","PeriodicalId":36083,"journal":{"name":"British and Irish Orthoptic Journal","volume":"15 1","pages":"47-52"},"PeriodicalIF":0.0000,"publicationDate":"2019-04-11","publicationTypes":"Journal Article","fieldsOfStudy":null,"isOpenAccess":false,"openAccessPdf":"https://www.ncbi.nlm.nih.gov/pmc/articles/PMC7510395/pdf/","citationCount":"1","resultStr":null,"platform":"Semanticscholar","paperid":null,"PeriodicalName":"British and Irish Orthoptic Journal","FirstCategoryId":"1085","ListUrlMain":"https://doi.org/10.22599/bioj.127","RegionNum":0,"RegionCategory":null,"ArticlePicture":[],"TitleCN":null,"AbstractTextCN":null,"PMCID":null,"EPubDate":"","PubModel":"","JCR":"Q3","JCRName":"Medicine","Score":null,"Total":0}
引用次数: 1
Abstract
Aim: The aim of this study was to determine and compare test-retest variability (TRV) of the computerised visual acuity (VA) COMPlog system on participants with normal vision and non-normal vision induced by bangerter foils (BFs).
Methods: Twenty adult volunteers with VA of 0.100 logMAR or better in each eye and no eye conditions were included. Monocular VA data using the COMPlog system under five conditions-with plain Plano glasses (visually normal condition) and four pairs of Plano glasses with BF strengths of 0.6, 0.3, 0.2 and 0.1 (induced non-normal vision conditions)-were collected on two separate visits. To reduce bias, the eye tested and order of the BFs assessed were randomised. Data comparison was analysed using 2-factor ANOVA and paired t-tests and Bland Altman analysis to assess TRV.
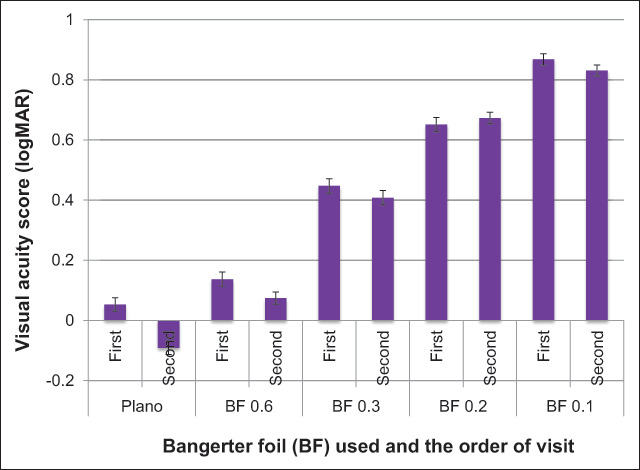
Results: Mean VA score from the two visits was -0.072 ± 0.1 logMAR for Plano, 0.106 ± 0.1 logMAR for BF 0.6, 0.428 ± 0.1 logMAR for BF 0.3, 0.662 ± 0.09 logMAR for BF 0.2 and 0.850 ± 0.08 logMAR for BF 0.1. As BF density increased, VA score significantly worsened (p < 0.0001). Overall mean VA score from the first and second visit was 0.410 ± 0.4 logMAR and 0.379 ± 0.4 logMAR, respectively. This improvement was significant (p < 0.009). The 95% limits of agreement of the VA scores between testing conditions had a range of ±0.120 to ±0.220 logMAR.
Conclusions: Increase in BF strength led to a worsened VA score. However, the COMPlog TRV under the visually normal and induced non-normal vision conditions were within a similar range (±0.120 to ±0.220 logMAR). VA significantly improved on the second visit, suggesting a possible learning effect, which could have a clinical impact.

 求助内容:
求助内容: 应助结果提醒方式:


