{"title":"Does the EyeChart App for iPhones Give Comparable Measurements to Traditional Visual Acuity Charts?","authors":"Katie Ansell, Gail Maconachie, Anne Bjerre","doi":"10.22599/bioj.146","DOIUrl":null,"url":null,"abstract":"<p><strong>Aim: </strong>To investigate if the EyeChart app gives accurate visual acuity (VA) measurements that are comparable to those achieved using traditional VA charts.</p><p><strong>Method: </strong>Twenty-four participants (aged 18-27 years, mean 20.13 ± 1.78 years) with VA of 6/60 Snellen or better regardless of any strabismus, amblyopia, or ocular pathology volunteered for this prospective study. The best-corrected monocular VA of each participant's right eye was measured on the Snellen chart at 6 m, the ETDRS chart at 3 m, and the EyeChart app presented on an iPhone SE at 1.2 m (4ft).</p><p><strong>Results: </strong>The mean VA scores obtained were: -0.13 ± 0.08 logMAR on the Snellen chart, -0.11 ± 0.08 logMAR on the ETDRS chart, and -0.09 ± 0.07 logMAR on the EyeChart app. After Bonferroni Correction adjustments were applied, a significant difference was found between the EyeChart app and the Snellen chart (t = -3.756, p = 0.003), however the difference between the EyeChart app and the ETDRS chart did not reach statistical significance (t = -2.391, p = 0.076). The EyeChart app had a strong correlation with both the Snellen (r = 0.79, p < 0.01) and ETDRS charts (r = 0.88, p < 0.01). The Coefficients of Agreement revealed a variation of less than one logMAR line between the EyeChart app and the traditional VA charts (Snellen: 0.09 logMAR; ETDRS: 0.08 logMAR).</p><p><strong>Conclusion: </strong>This study found that the EyeChart app gives accurate VA scores that are comparable to those achieved using the gold-standard ETDRS chart in a healthy young adult population. However, the accuracy and repeatability of the EyeChart app when testing a patient population must be investigated before it can be integrated into clinical practice.</p>","PeriodicalId":36083,"journal":{"name":"British and Irish Orthoptic Journal","volume":"16 1","pages":"19-24"},"PeriodicalIF":0.0000,"publicationDate":"2020-04-15","publicationTypes":"Journal Article","fieldsOfStudy":null,"isOpenAccess":false,"openAccessPdf":"https://www.ncbi.nlm.nih.gov/pmc/articles/PMC7510399/pdf/","citationCount":"10","resultStr":null,"platform":"Semanticscholar","paperid":null,"PeriodicalName":"British and Irish Orthoptic Journal","FirstCategoryId":"1085","ListUrlMain":"https://doi.org/10.22599/bioj.146","RegionNum":0,"RegionCategory":null,"ArticlePicture":[],"TitleCN":null,"AbstractTextCN":null,"PMCID":null,"EPubDate":"","PubModel":"","JCR":"Q3","JCRName":"Medicine","Score":null,"Total":0}
引用次数: 10
Abstract
Aim: To investigate if the EyeChart app gives accurate visual acuity (VA) measurements that are comparable to those achieved using traditional VA charts.
Method: Twenty-four participants (aged 18-27 years, mean 20.13 ± 1.78 years) with VA of 6/60 Snellen or better regardless of any strabismus, amblyopia, or ocular pathology volunteered for this prospective study. The best-corrected monocular VA of each participant's right eye was measured on the Snellen chart at 6 m, the ETDRS chart at 3 m, and the EyeChart app presented on an iPhone SE at 1.2 m (4ft).
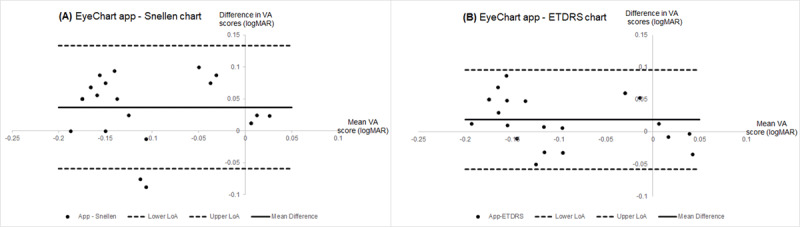
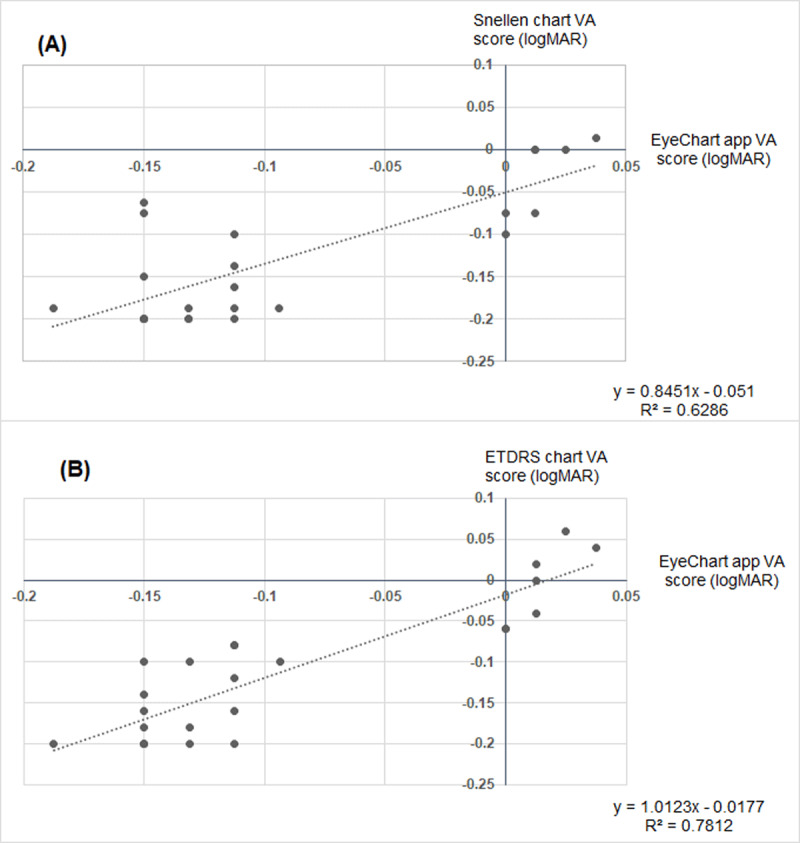
Results: The mean VA scores obtained were: -0.13 ± 0.08 logMAR on the Snellen chart, -0.11 ± 0.08 logMAR on the ETDRS chart, and -0.09 ± 0.07 logMAR on the EyeChart app. After Bonferroni Correction adjustments were applied, a significant difference was found between the EyeChart app and the Snellen chart (t = -3.756, p = 0.003), however the difference between the EyeChart app and the ETDRS chart did not reach statistical significance (t = -2.391, p = 0.076). The EyeChart app had a strong correlation with both the Snellen (r = 0.79, p < 0.01) and ETDRS charts (r = 0.88, p < 0.01). The Coefficients of Agreement revealed a variation of less than one logMAR line between the EyeChart app and the traditional VA charts (Snellen: 0.09 logMAR; ETDRS: 0.08 logMAR).
Conclusion: This study found that the EyeChart app gives accurate VA scores that are comparable to those achieved using the gold-standard ETDRS chart in a healthy young adult population. However, the accuracy and repeatability of the EyeChart app when testing a patient population must be investigated before it can be integrated into clinical practice.

 求助内容:
求助内容: 应助结果提醒方式:


