Elizabeth A Castner, Allison M Leach, Jana E Compton, James N Galloway, Jennifer Andrews
{"title":"Comparing Institution Nitrogen Footprints: Metrics for Assessing and Tracking Environmental Impact.","authors":"Elizabeth A Castner, Allison M Leach, Jana E Compton, James N Galloway, Jennifer Andrews","doi":"10.1089/sus.2017.29090.eac","DOIUrl":null,"url":null,"abstract":"<p><p>When multiple institutions with strong sustainability initiatives use a new environmental impact assessment tool, there is an impulse to compare. The first seven institutions to calculate nitrogen footprints using the Nitrogen Footprint Tool have worked collaboratively to improve calculation methods, share resources, and suggest methods for reducing their footprints. This article compares those seven institutions' results to reveal the common and unique drivers of institution nitrogen footprints. The footprints were compared by scope and sector, and the results were normalized by multiple factors (e.g., population, amount of food served). The comparisons found many consistencies across the footprints, including the large contribution of food. The comparisons identified metrics that could be used to track progress, such as an overall indicator for the nitrogen sustainability of food purchases. The comparisons also pointed to differences in system bounds of the calculations, which are important to standardize when comparing across institutions. The footprints were influenced by factors both within and outside of the institutions' ability to control, such as size, location, population, and campus use. However, these comparisons also point to a pathway forward for standardizing nitrogen footprint tool calculations, identifying metrics that can be used to track progress, and determining a sustainable institution nitrogen footprint.</p>","PeriodicalId":92296,"journal":{"name":"Sustainability (New Rochelle, N.Y.)","volume":"10 2","pages":"105-113"},"PeriodicalIF":0.0000,"publicationDate":"2017-04-01","publicationTypes":"Journal Article","fieldsOfStudy":null,"isOpenAccess":false,"openAccessPdf":"https://sci-hub-pdf.com/10.1089/sus.2017.29090.eac","citationCount":"4","resultStr":null,"platform":"Semanticscholar","paperid":null,"PeriodicalName":"Sustainability (New Rochelle, N.Y.)","FirstCategoryId":"1085","ListUrlMain":"https://doi.org/10.1089/sus.2017.29090.eac","RegionNum":0,"RegionCategory":null,"ArticlePicture":[],"TitleCN":null,"AbstractTextCN":null,"PMCID":null,"EPubDate":"","PubModel":"","JCR":"","JCRName":"","Score":null,"Total":0}
引用次数: 4
Abstract
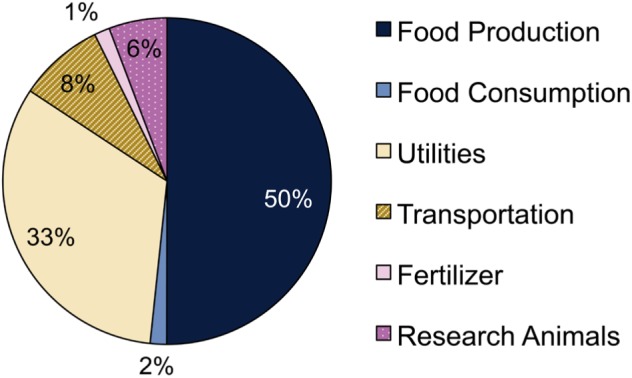
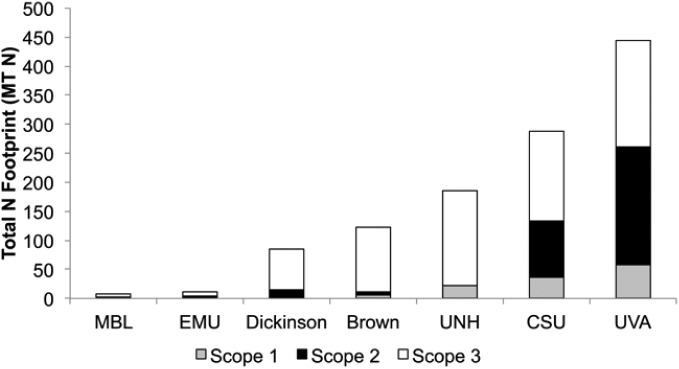
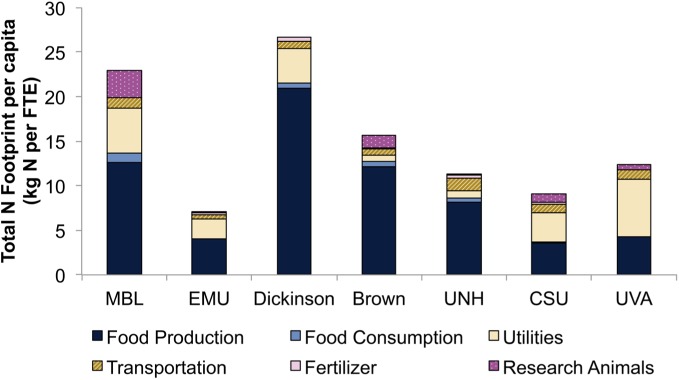
When multiple institutions with strong sustainability initiatives use a new environmental impact assessment tool, there is an impulse to compare. The first seven institutions to calculate nitrogen footprints using the Nitrogen Footprint Tool have worked collaboratively to improve calculation methods, share resources, and suggest methods for reducing their footprints. This article compares those seven institutions' results to reveal the common and unique drivers of institution nitrogen footprints. The footprints were compared by scope and sector, and the results were normalized by multiple factors (e.g., population, amount of food served). The comparisons found many consistencies across the footprints, including the large contribution of food. The comparisons identified metrics that could be used to track progress, such as an overall indicator for the nitrogen sustainability of food purchases. The comparisons also pointed to differences in system bounds of the calculations, which are important to standardize when comparing across institutions. The footprints were influenced by factors both within and outside of the institutions' ability to control, such as size, location, population, and campus use. However, these comparisons also point to a pathway forward for standardizing nitrogen footprint tool calculations, identifying metrics that can be used to track progress, and determining a sustainable institution nitrogen footprint.

 求助内容:
求助内容: 应助结果提醒方式:


