{"title":"Do the Wettest Days Occur Together? A Global Analysis on Disentangling Precipitation Intensity From Seasonal Timing","authors":"Saurav Bhattarai, Nawa Raj Pradhan, Rocky Talchabhadel","doi":"10.1029/2025EA004845","DOIUrl":null,"url":null,"abstract":"<p>Current precipitation analysis focuses on extreme events or total amounts but misses a critical question: when does the majority of precipitation occur during the year? We introduce a framework that separates two fundamental aspects of precipitation patterns: how many of the wettest individual days contribute to annual totals versus what is the minimum number of consecutive days required to reach the same totals. Using ERA5 data spanning 1980–2024 over global land surfaces, we first compute multi-threshold indices for 25%, 50%, and 75% of annual precipitation through both approaches—selecting the wettest days scattered throughout the year (WD25, WD50, WD75) and then find the shortest consecutive periods (WD25R, WD50R, WD75R). Results show these two dimensions evolve independently: notably, the Amazon Basin shows 15%–18% fewer days needed through both approaches (more concentrated and more consecutive), while continental regions like eastern North America show 12%–25% increases (more scattered and less consecutive). Monsoon regions demonstrate strong alignment between wettest days and consecutive periods (concentrated rainy seasons), while mid-latitude regions show large misalignments (scattered patterns). These findings demonstrate that identical changes in precipitation intensity can produce opposite changes in seasonal timing—a distinction critical for flood risk, drought duration, and water storage that traditional extreme event indices cannot capture.</p>","PeriodicalId":54286,"journal":{"name":"Earth and Space Science","volume":"13 4","pages":""},"PeriodicalIF":2.6000,"publicationDate":"2026-04-02","publicationTypes":"Journal Article","fieldsOfStudy":null,"isOpenAccess":false,"openAccessPdf":"https://agupubs.onlinelibrary.wiley.com/doi/epdf/10.1029/2025EA004845","citationCount":"0","resultStr":null,"platform":"Semanticscholar","paperid":null,"PeriodicalName":"Earth and Space Science","FirstCategoryId":"89","ListUrlMain":"https://agupubs.onlinelibrary.wiley.com/doi/10.1029/2025EA004845","RegionNum":3,"RegionCategory":"地球科学","ArticlePicture":[],"TitleCN":null,"AbstractTextCN":null,"PMCID":null,"EPubDate":"","PubModel":"","JCR":"Q2","JCRName":"ASTRONOMY & ASTROPHYSICS","Score":null,"Total":0}
引用次数: 0
Abstract
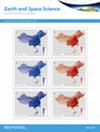
Current precipitation analysis focuses on extreme events or total amounts but misses a critical question: when does the majority of precipitation occur during the year? We introduce a framework that separates two fundamental aspects of precipitation patterns: how many of the wettest individual days contribute to annual totals versus what is the minimum number of consecutive days required to reach the same totals. Using ERA5 data spanning 1980–2024 over global land surfaces, we first compute multi-threshold indices for 25%, 50%, and 75% of annual precipitation through both approaches—selecting the wettest days scattered throughout the year (WD25, WD50, WD75) and then find the shortest consecutive periods (WD25R, WD50R, WD75R). Results show these two dimensions evolve independently: notably, the Amazon Basin shows 15%–18% fewer days needed through both approaches (more concentrated and more consecutive), while continental regions like eastern North America show 12%–25% increases (more scattered and less consecutive). Monsoon regions demonstrate strong alignment between wettest days and consecutive periods (concentrated rainy seasons), while mid-latitude regions show large misalignments (scattered patterns). These findings demonstrate that identical changes in precipitation intensity can produce opposite changes in seasonal timing—a distinction critical for flood risk, drought duration, and water storage that traditional extreme event indices cannot capture.
期刊介绍:
Marking AGU’s second new open access journal in the last 12 months, Earth and Space Science is the only journal that reflects the expansive range of science represented by AGU’s 62,000 members, including all of the Earth, planetary, and space sciences, and related fields in environmental science, geoengineering, space engineering, and biogeochemistry.


 求助内容:
求助内容: 应助结果提醒方式:


